
Methodical Trading - Volume 22 - "Altcoin Circus!" 🚀
Bitcoin Update, Ethereum Flying, Alts Galore, & Institutions
This volume of Methodical Trading is free for everyone! Please show us your support remember to subscribe for free via our e-mail list! Keep calm and HODl strong!
Bitcoin has maintained a strong macro uptrend that is currently facing resistance around the $60,000 level.
Ethereum has once again broken the $2,000 level and is pushing into fresh All Time Highs. The BTC pair has rallied once again likely putting in a macro bottom.
Alts have popped off significantly, likely as a result of ETH/BTC rallying as well. Several Alts are included in the charts below.
Institutions continue to pour into Bitcoin as significant outflows off of Spot exchanges support the raging bull market.
Talking Points
Bitcoin Testing $60,000
Ethereum Flying
Alts Galore
Institutions
Bitcoin Testing $60,000
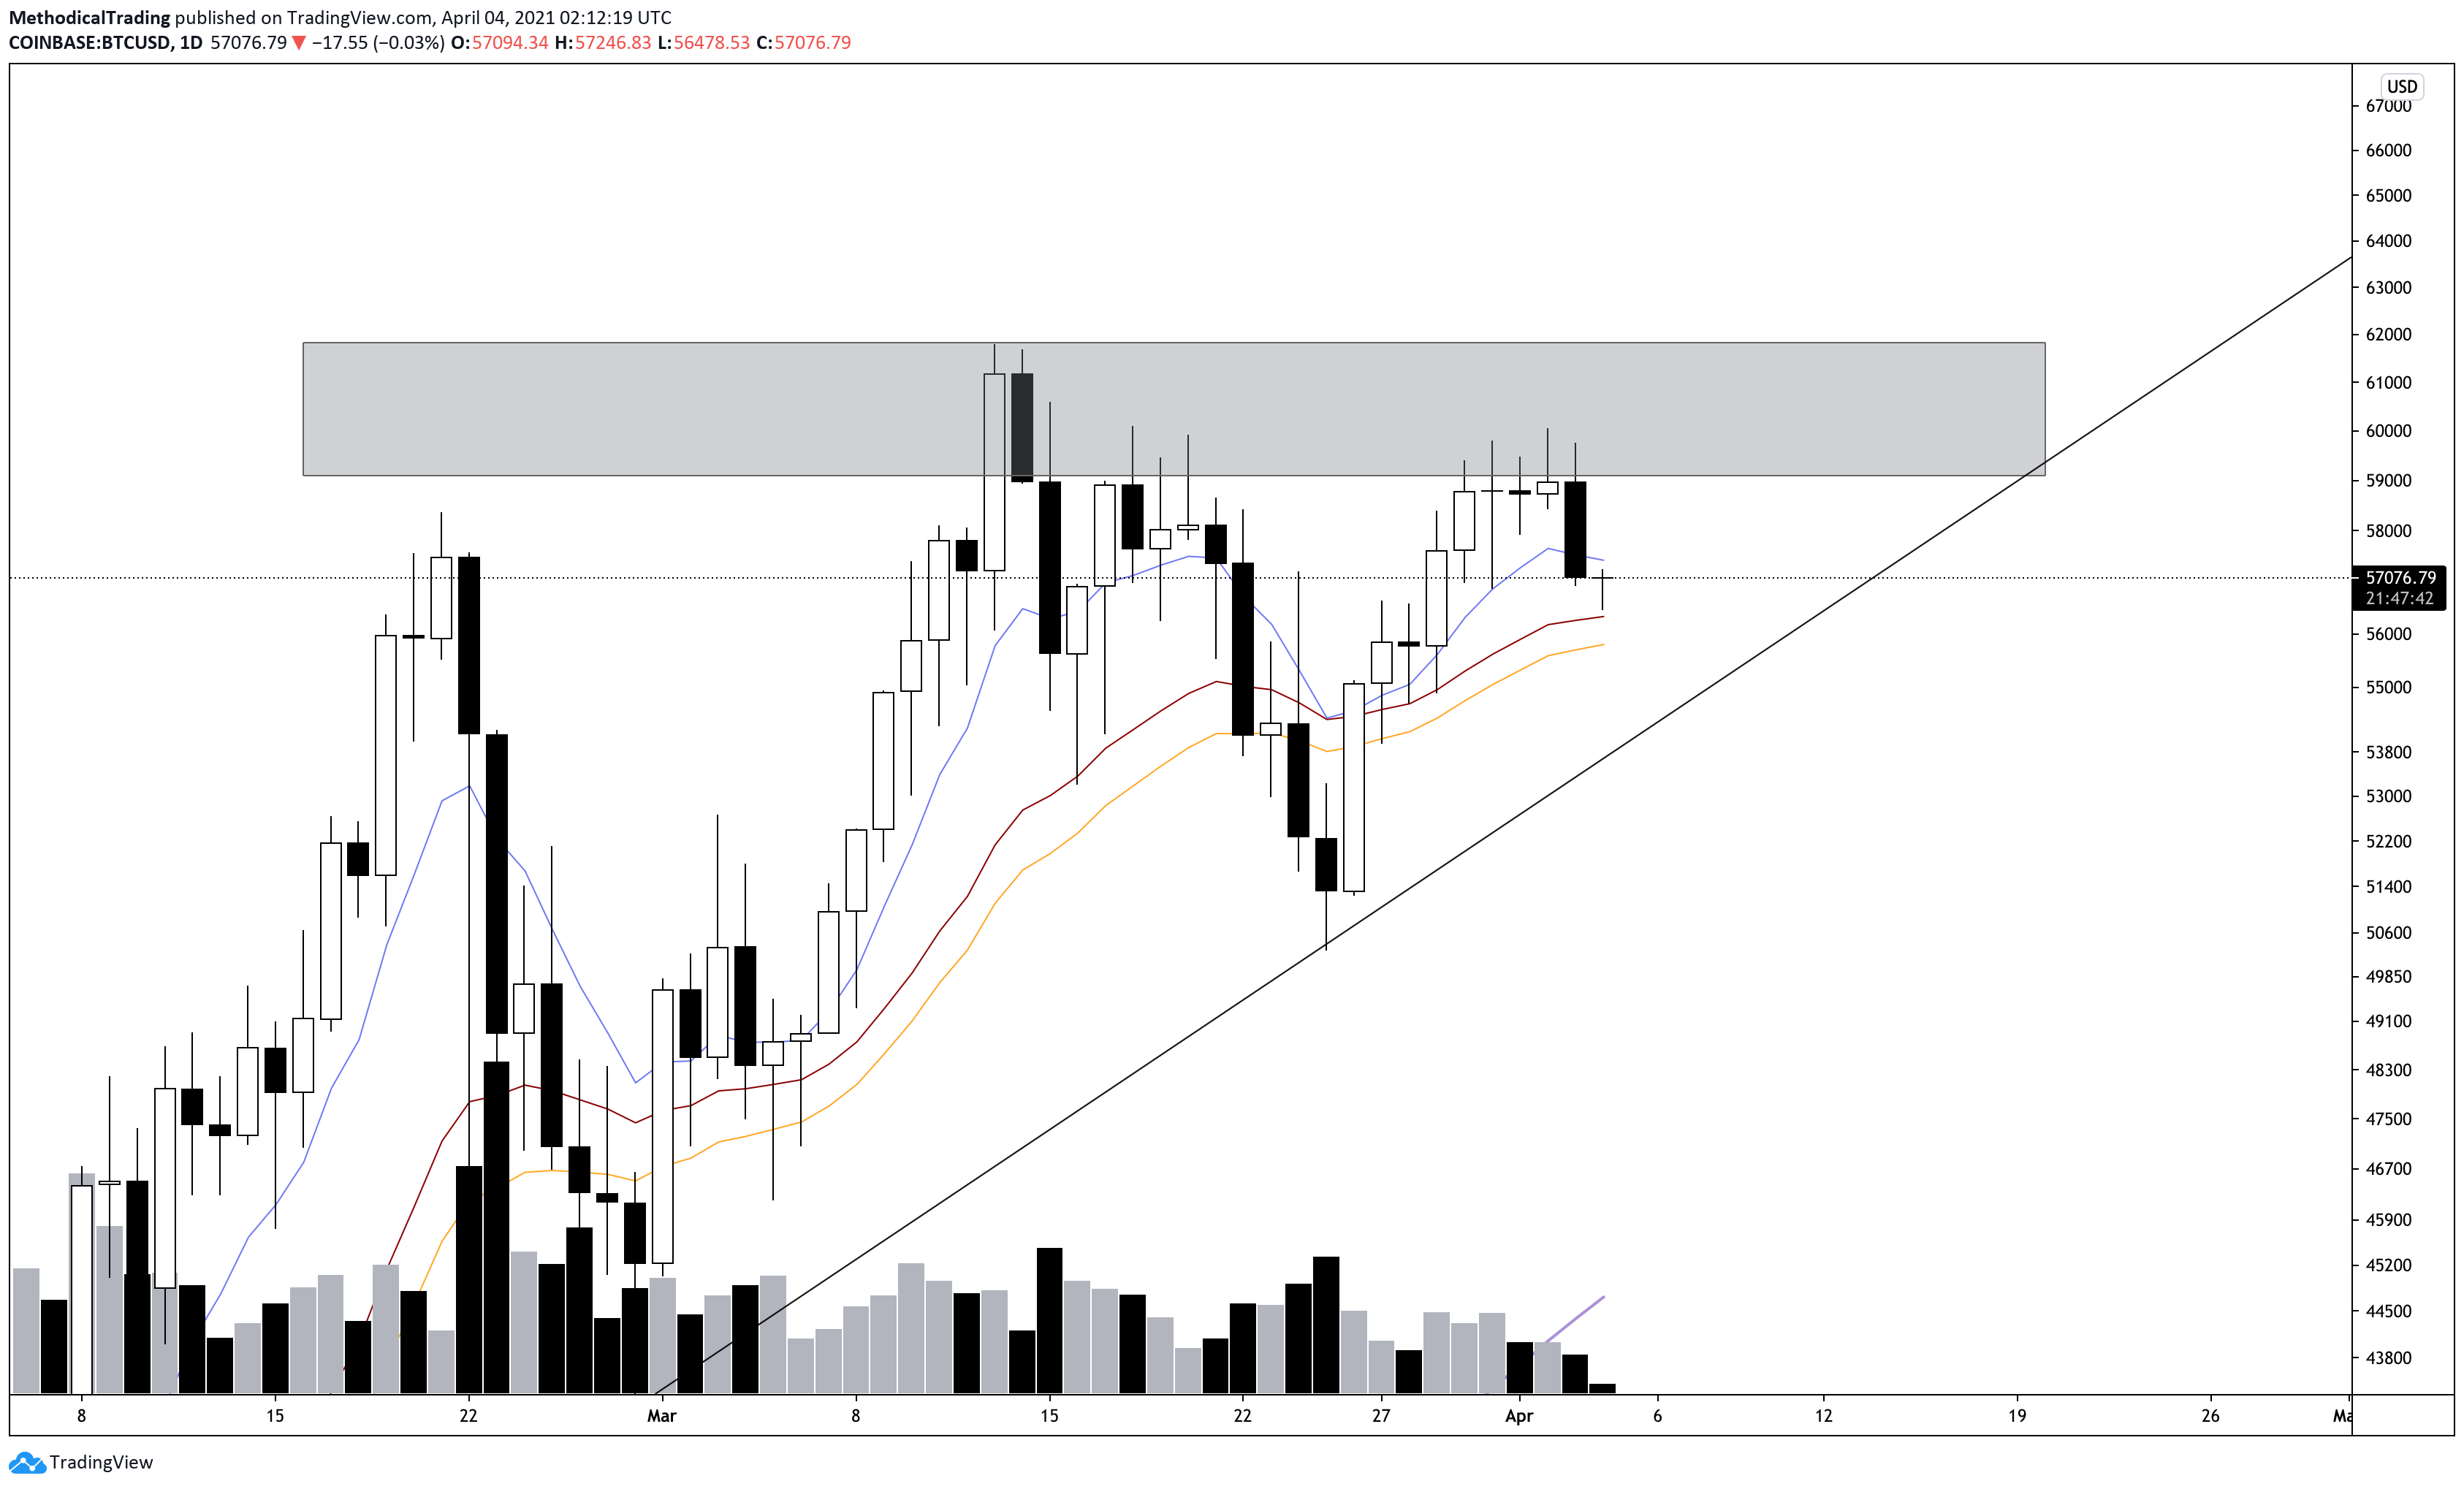
Taking a look at the Daily chart for Bitcoin, price has had several wicks to the upside as it consolidates just below the $60,000 region of resistance. Price has recently fallen slightly lower and nearly tapped the 21 EMA (Brown). Overall, Longs still look healthy as funding gets reset and late longers get stopped or liquidated from their positions. It would be ideal to continue wiping out these positions as price moves further up in order to maintain a healthy uptrend.
The only two scenarios worth paying attention to at the moment are either a breakout of the $60,000 level followed by a retest for Long positions OR a visit lower towards the rising trendline somewhere between $53,000 - $55,000. This would be a strong area of Support and would likely provide some relief or a full on reversal IF price were to get there. This scenario is invalidated IF Bitcoin were to firmly close below the rising trendline and below $53,000.
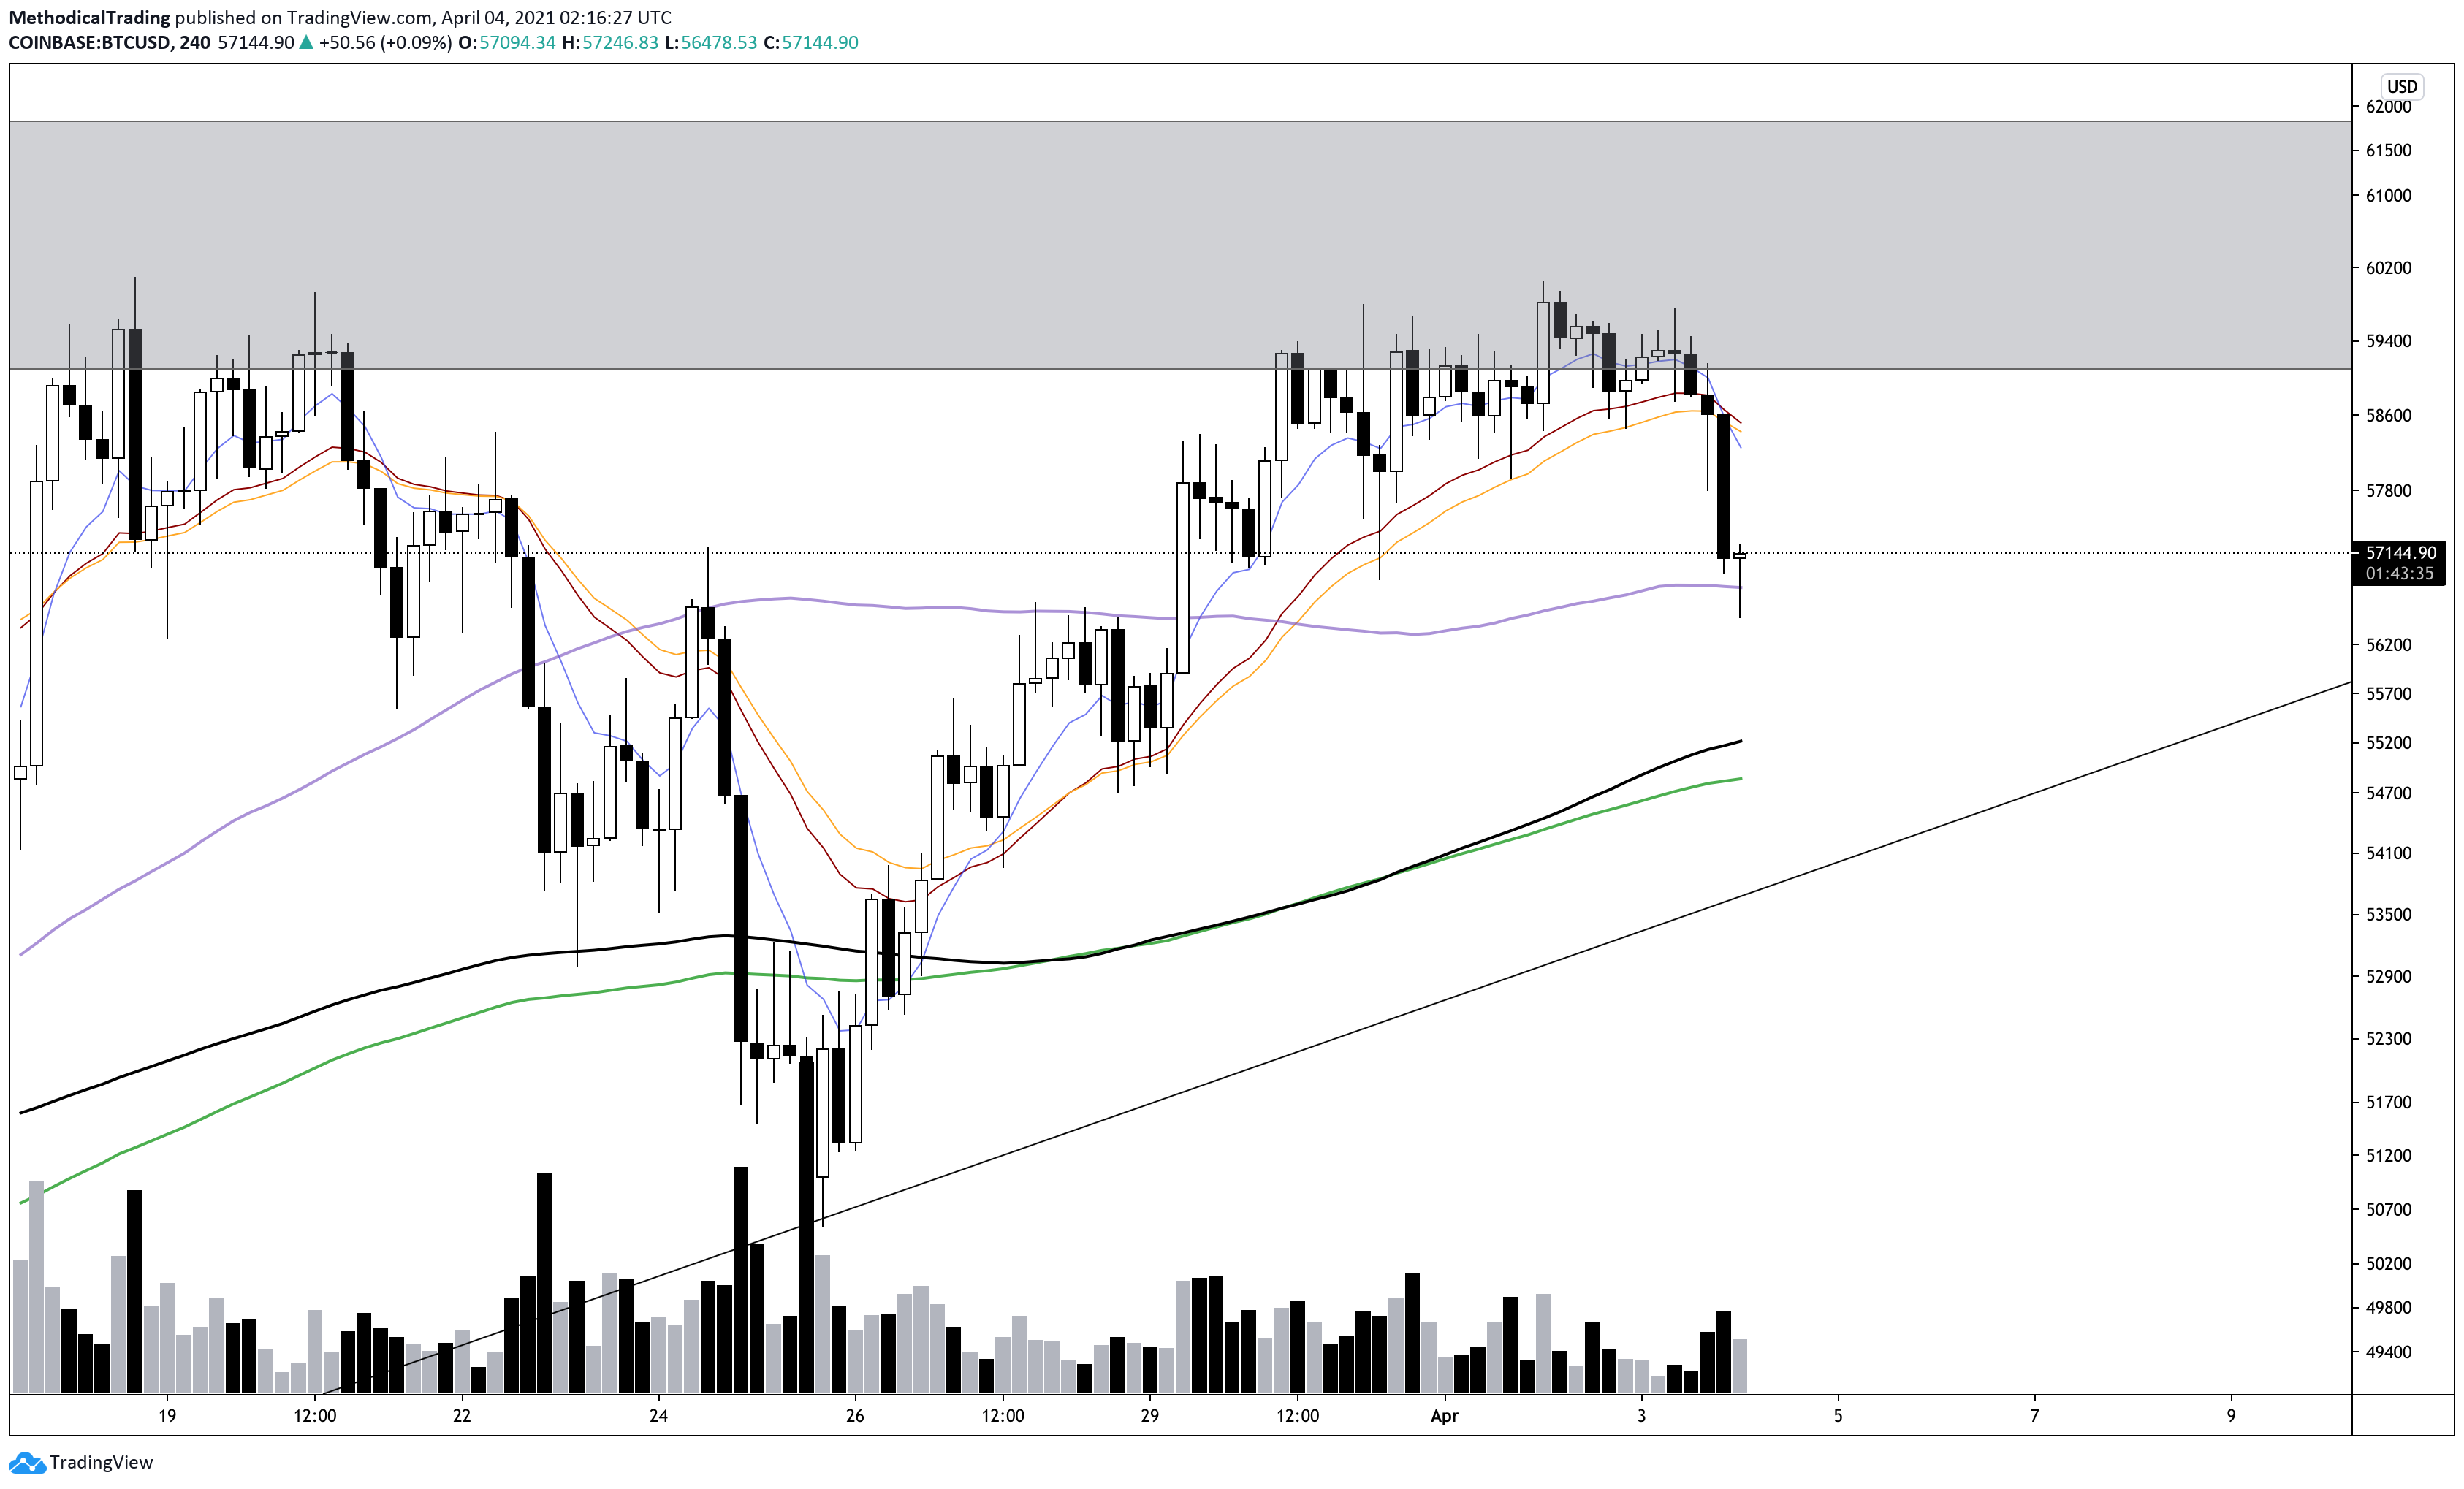
Zooming into the 4 hour, price has tapped the 100 MA (Purple) with a long wick. The current candle is a strong sign that buyers are still present and this is the third visit into this $57,000 region over the past few days. The 4 hour 200 EMA/MA (Green/Black) are the most crucial ones to keep an eye out for. This also lines up with the Support mentioned second scenario in the previous paragraph. This area between $53,000 - $55,000 looks like the most optimal area to continue buying the dip in preparation for an All Time High breakout above $62,000.
Ethereum Flying!
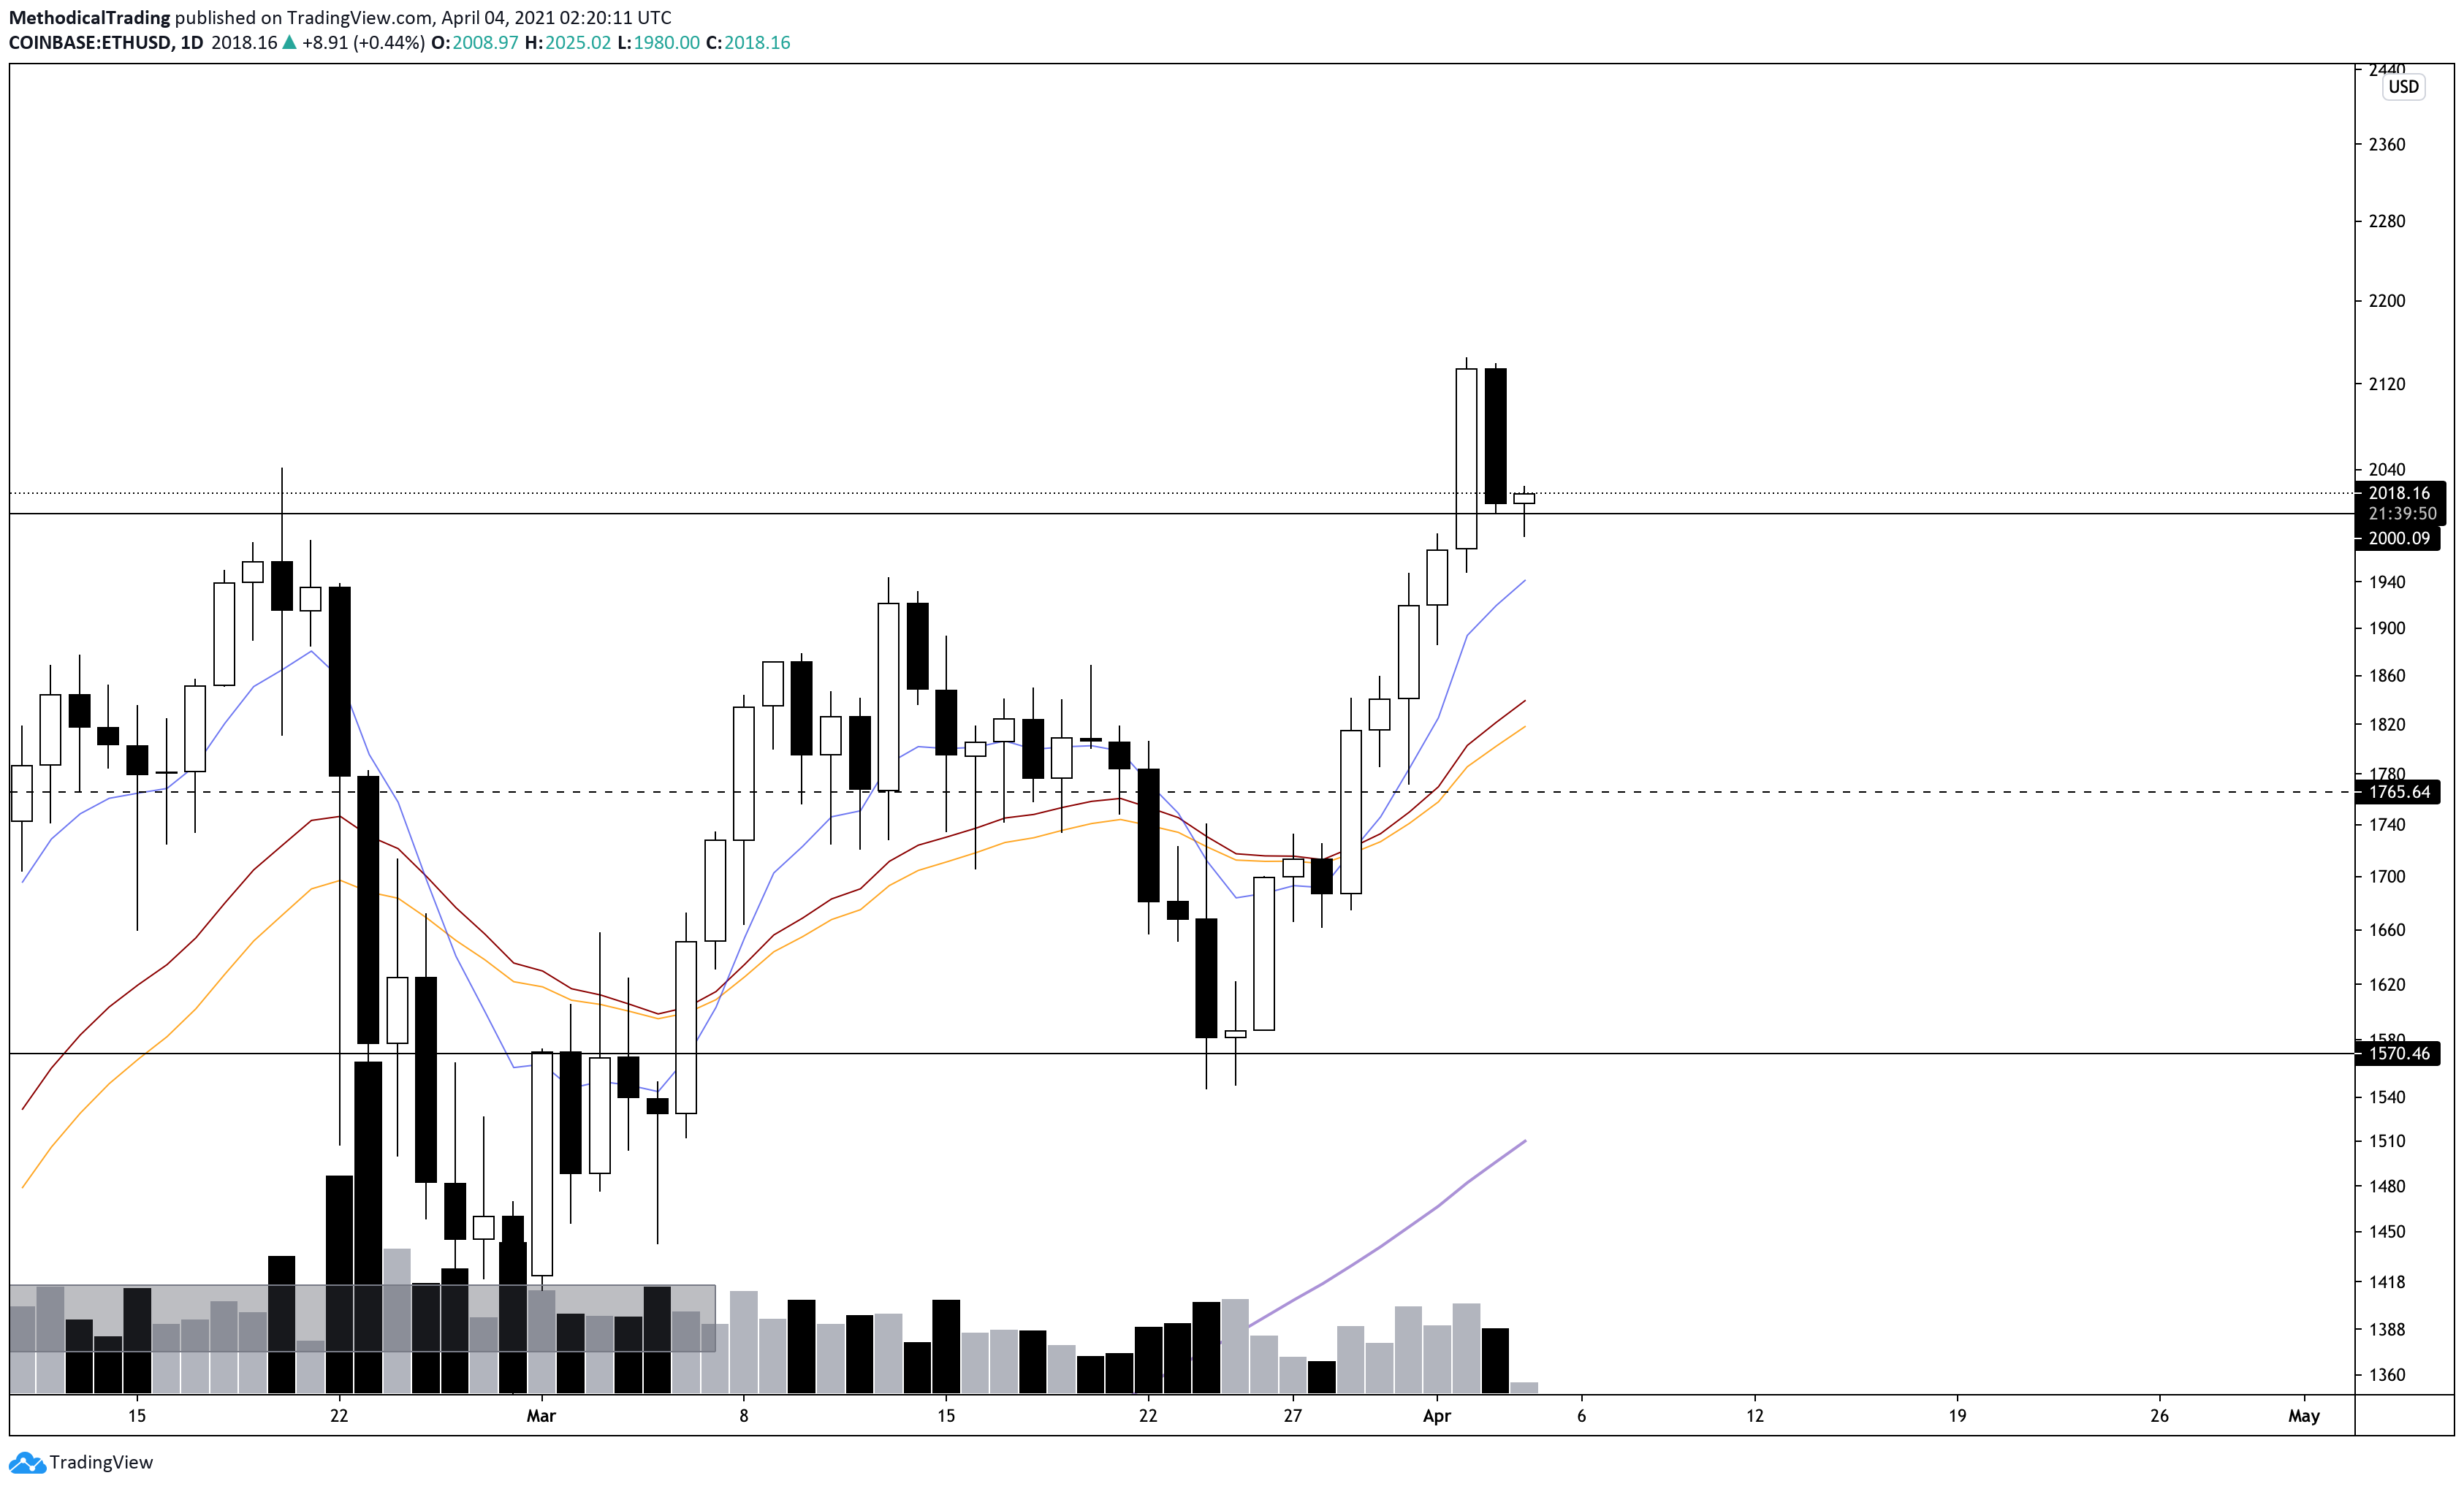
On the Daily chart, ETH/USD has had a strong rally over the past week and a half with a successful All Time High break. Price is currently retesting $2,000 region and suggests that ETH/USD is flipping previous Resistance into Support. This is the best case scenario for any Ethereum long positions and serves as a prime entry point as well.
A loss of the $2,000 region would likely result in a visit towards $1,765 and possibly below into the $1,500’s again. If Bitcoin does fall lower into more optimal levels to buy the dip, then ruling these scenarios out for Ethereum is not out of the picture either. Simply put, Bitcoin needs to continue to behave in order for ETH and other Alts to continue running under current market conditions. These scenarios are not macro bearish stances, rather, they are “buy-the-dip” scenarios that could create optimal long entries for both Spot and Leveraged plays.
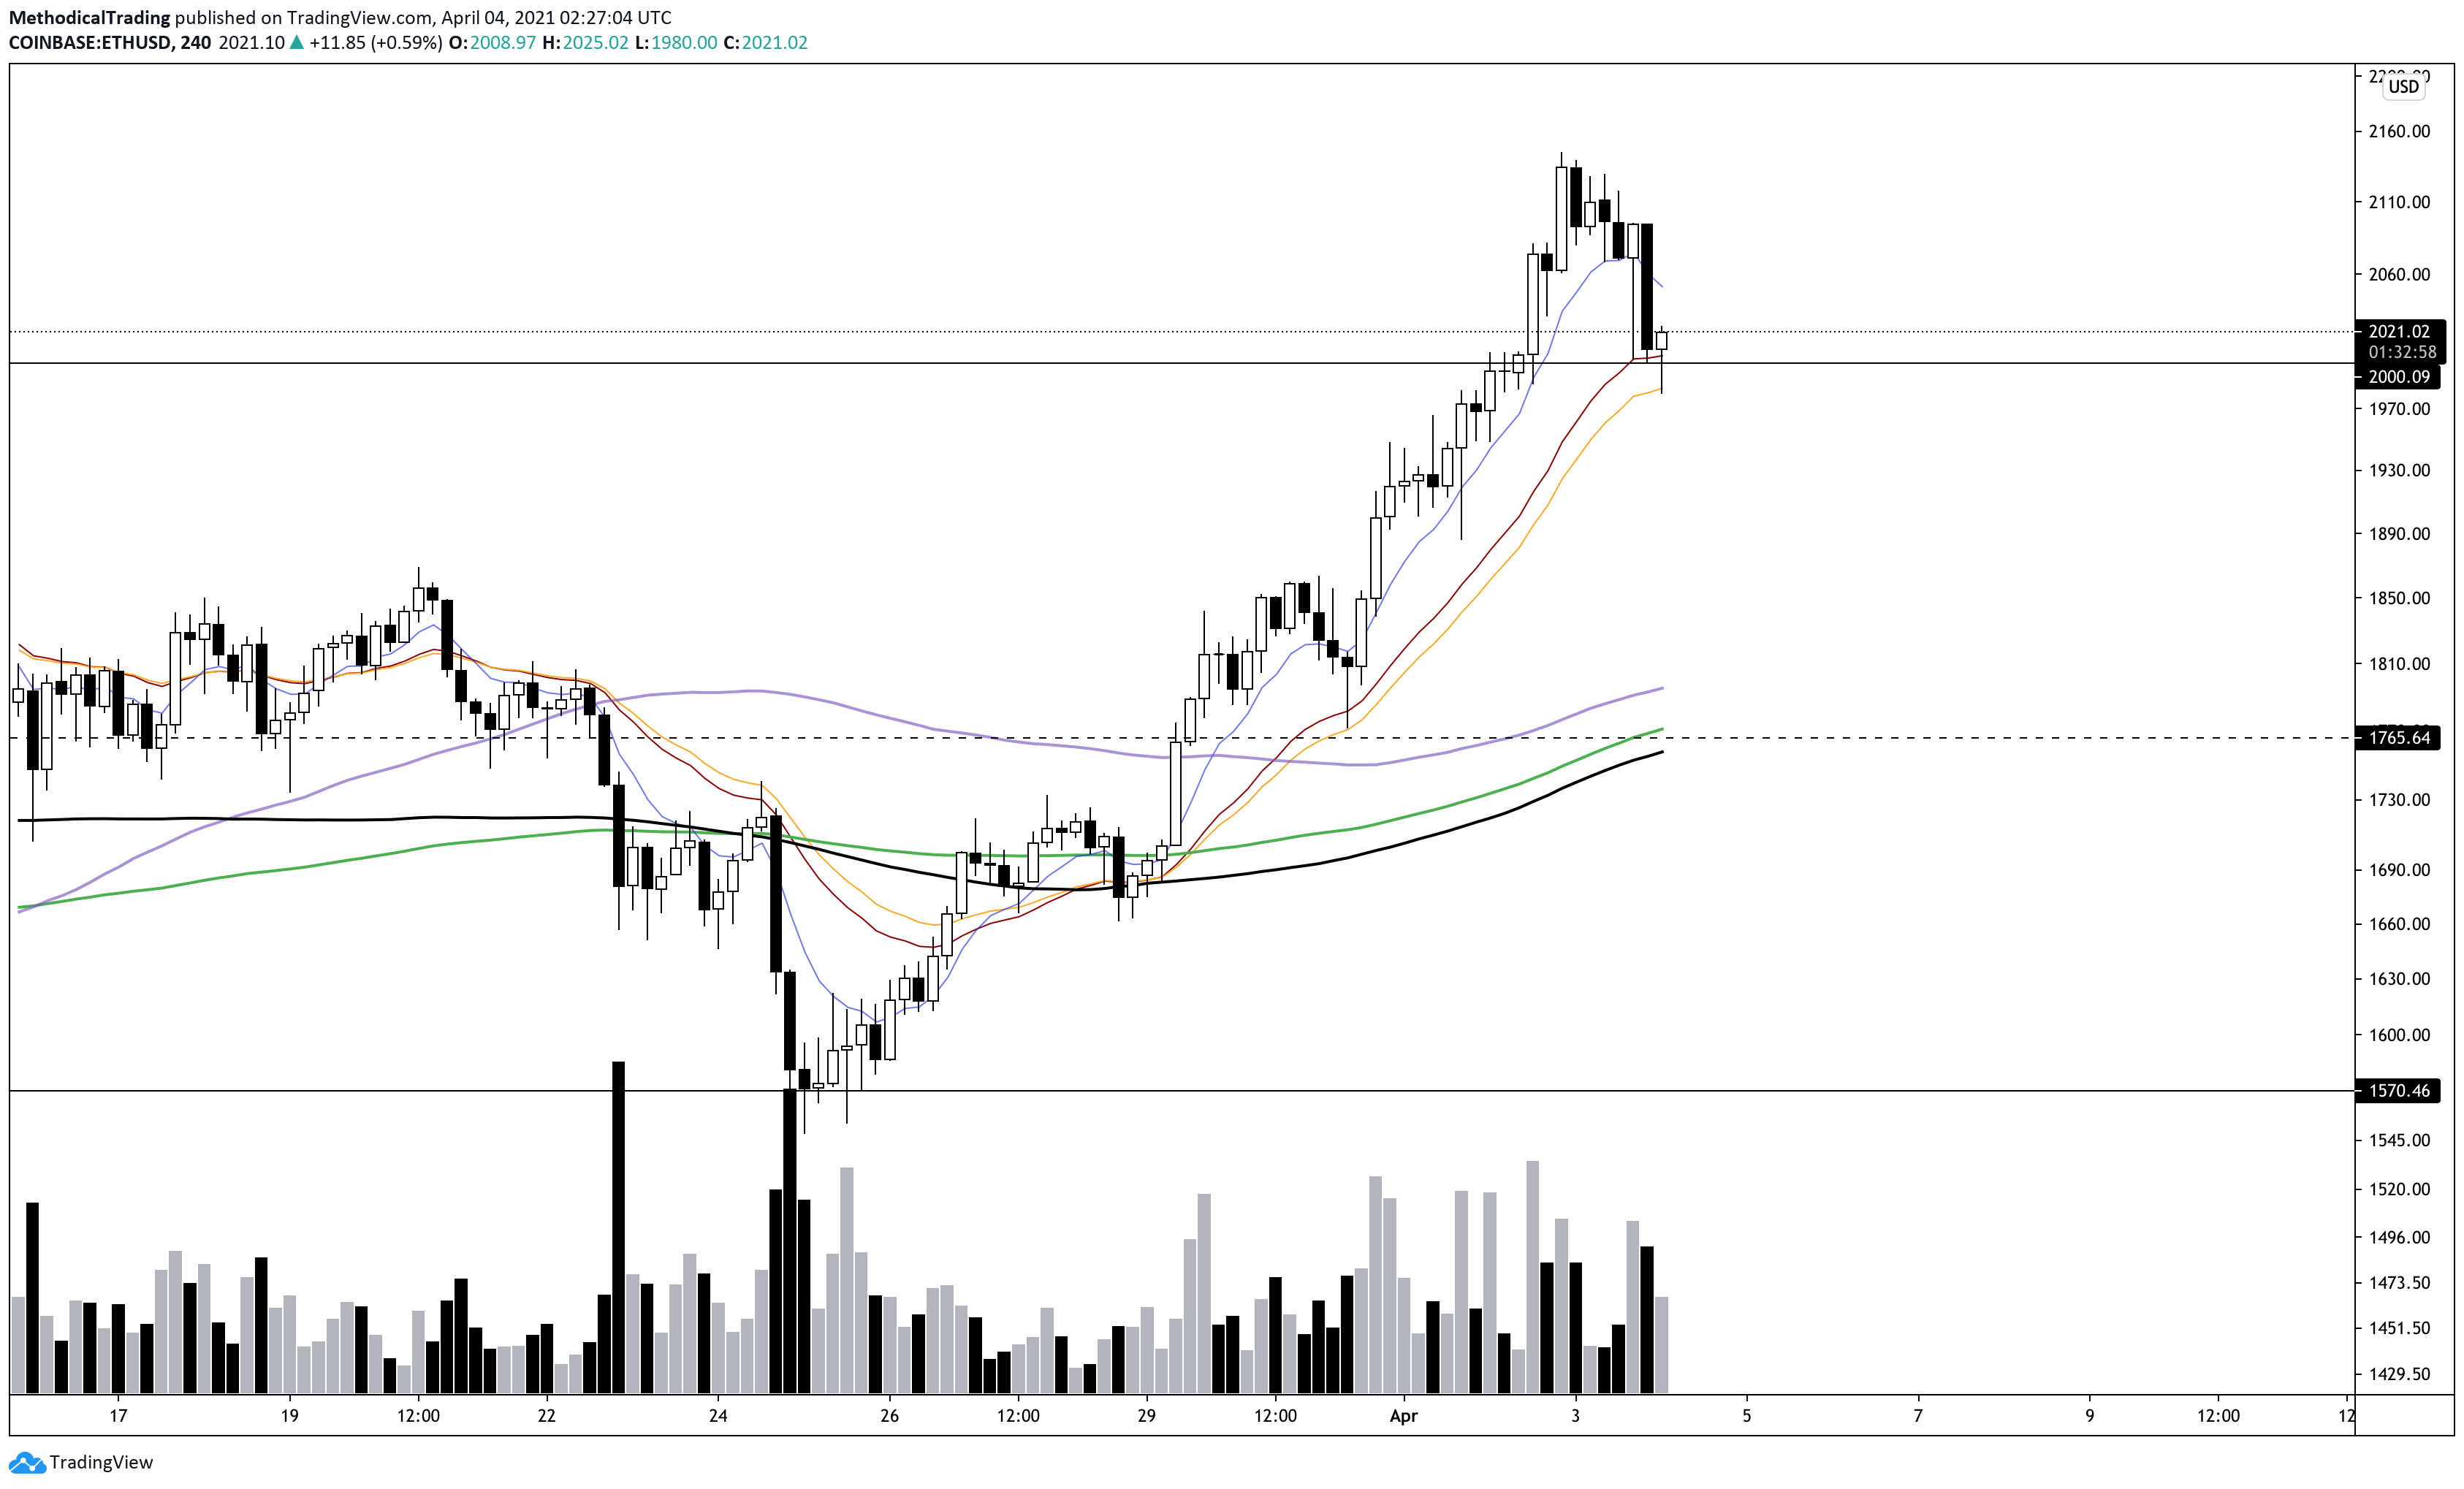
Zooming into the 4 hour, price is holding the 21/26 EMA’s (Brown/Orange) and shows further confirmation of a strong trend taking place. This is only the second test of these EMA’s and in confluence with the $2,000 region flip into Support, it seems likely that price will shoot for higher here (Again, this will more than likely only happen if Bitcoin behaves or moves higher as well). Blue Sky Breakouts are among the most successful trades to take in any market. This occurs when an asset reaches fresh All Time High territory.
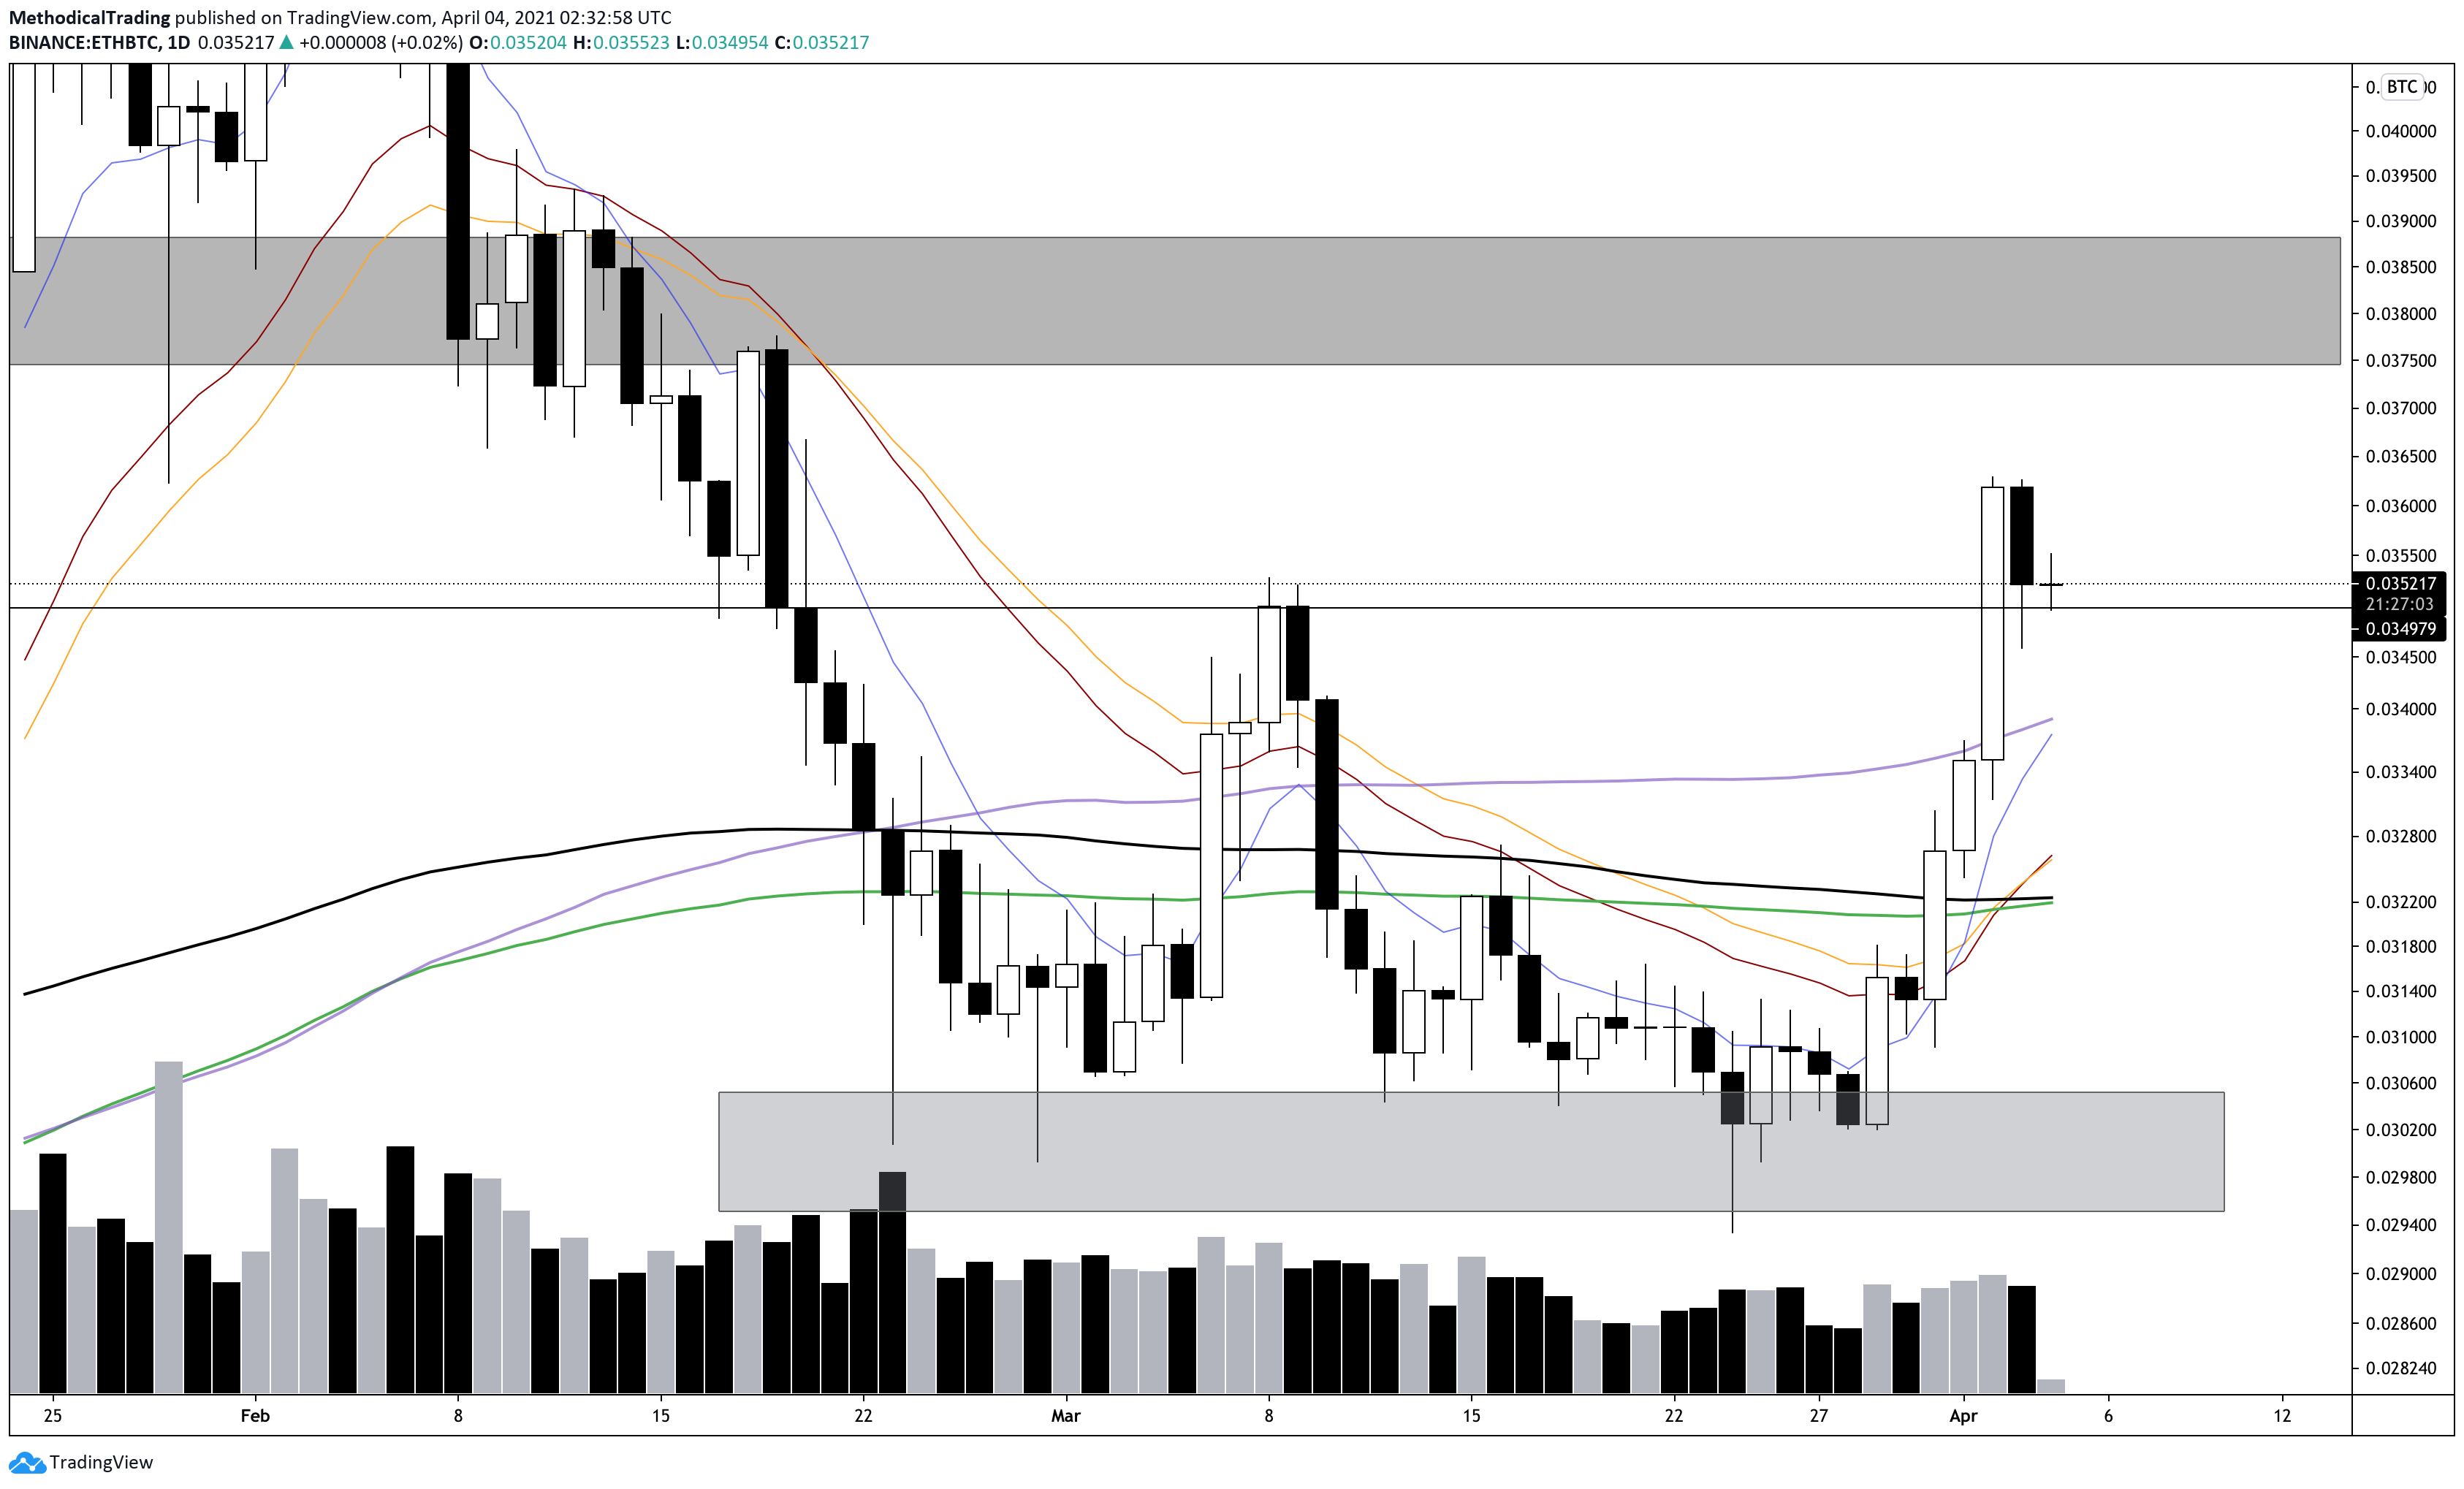
ETH/BTC tells a different story in comparison to ETH/USD. Price is nowhere near All Time High territory, but it is flipping previous Resistance into Support currently. Bitcoin’s recent consolidation and choppy price action has allowed further room for BTC pairs to run pretty hard. ETH/BTC looks good to move higher here into the upper gray region outlined above around the 0.038000 region.
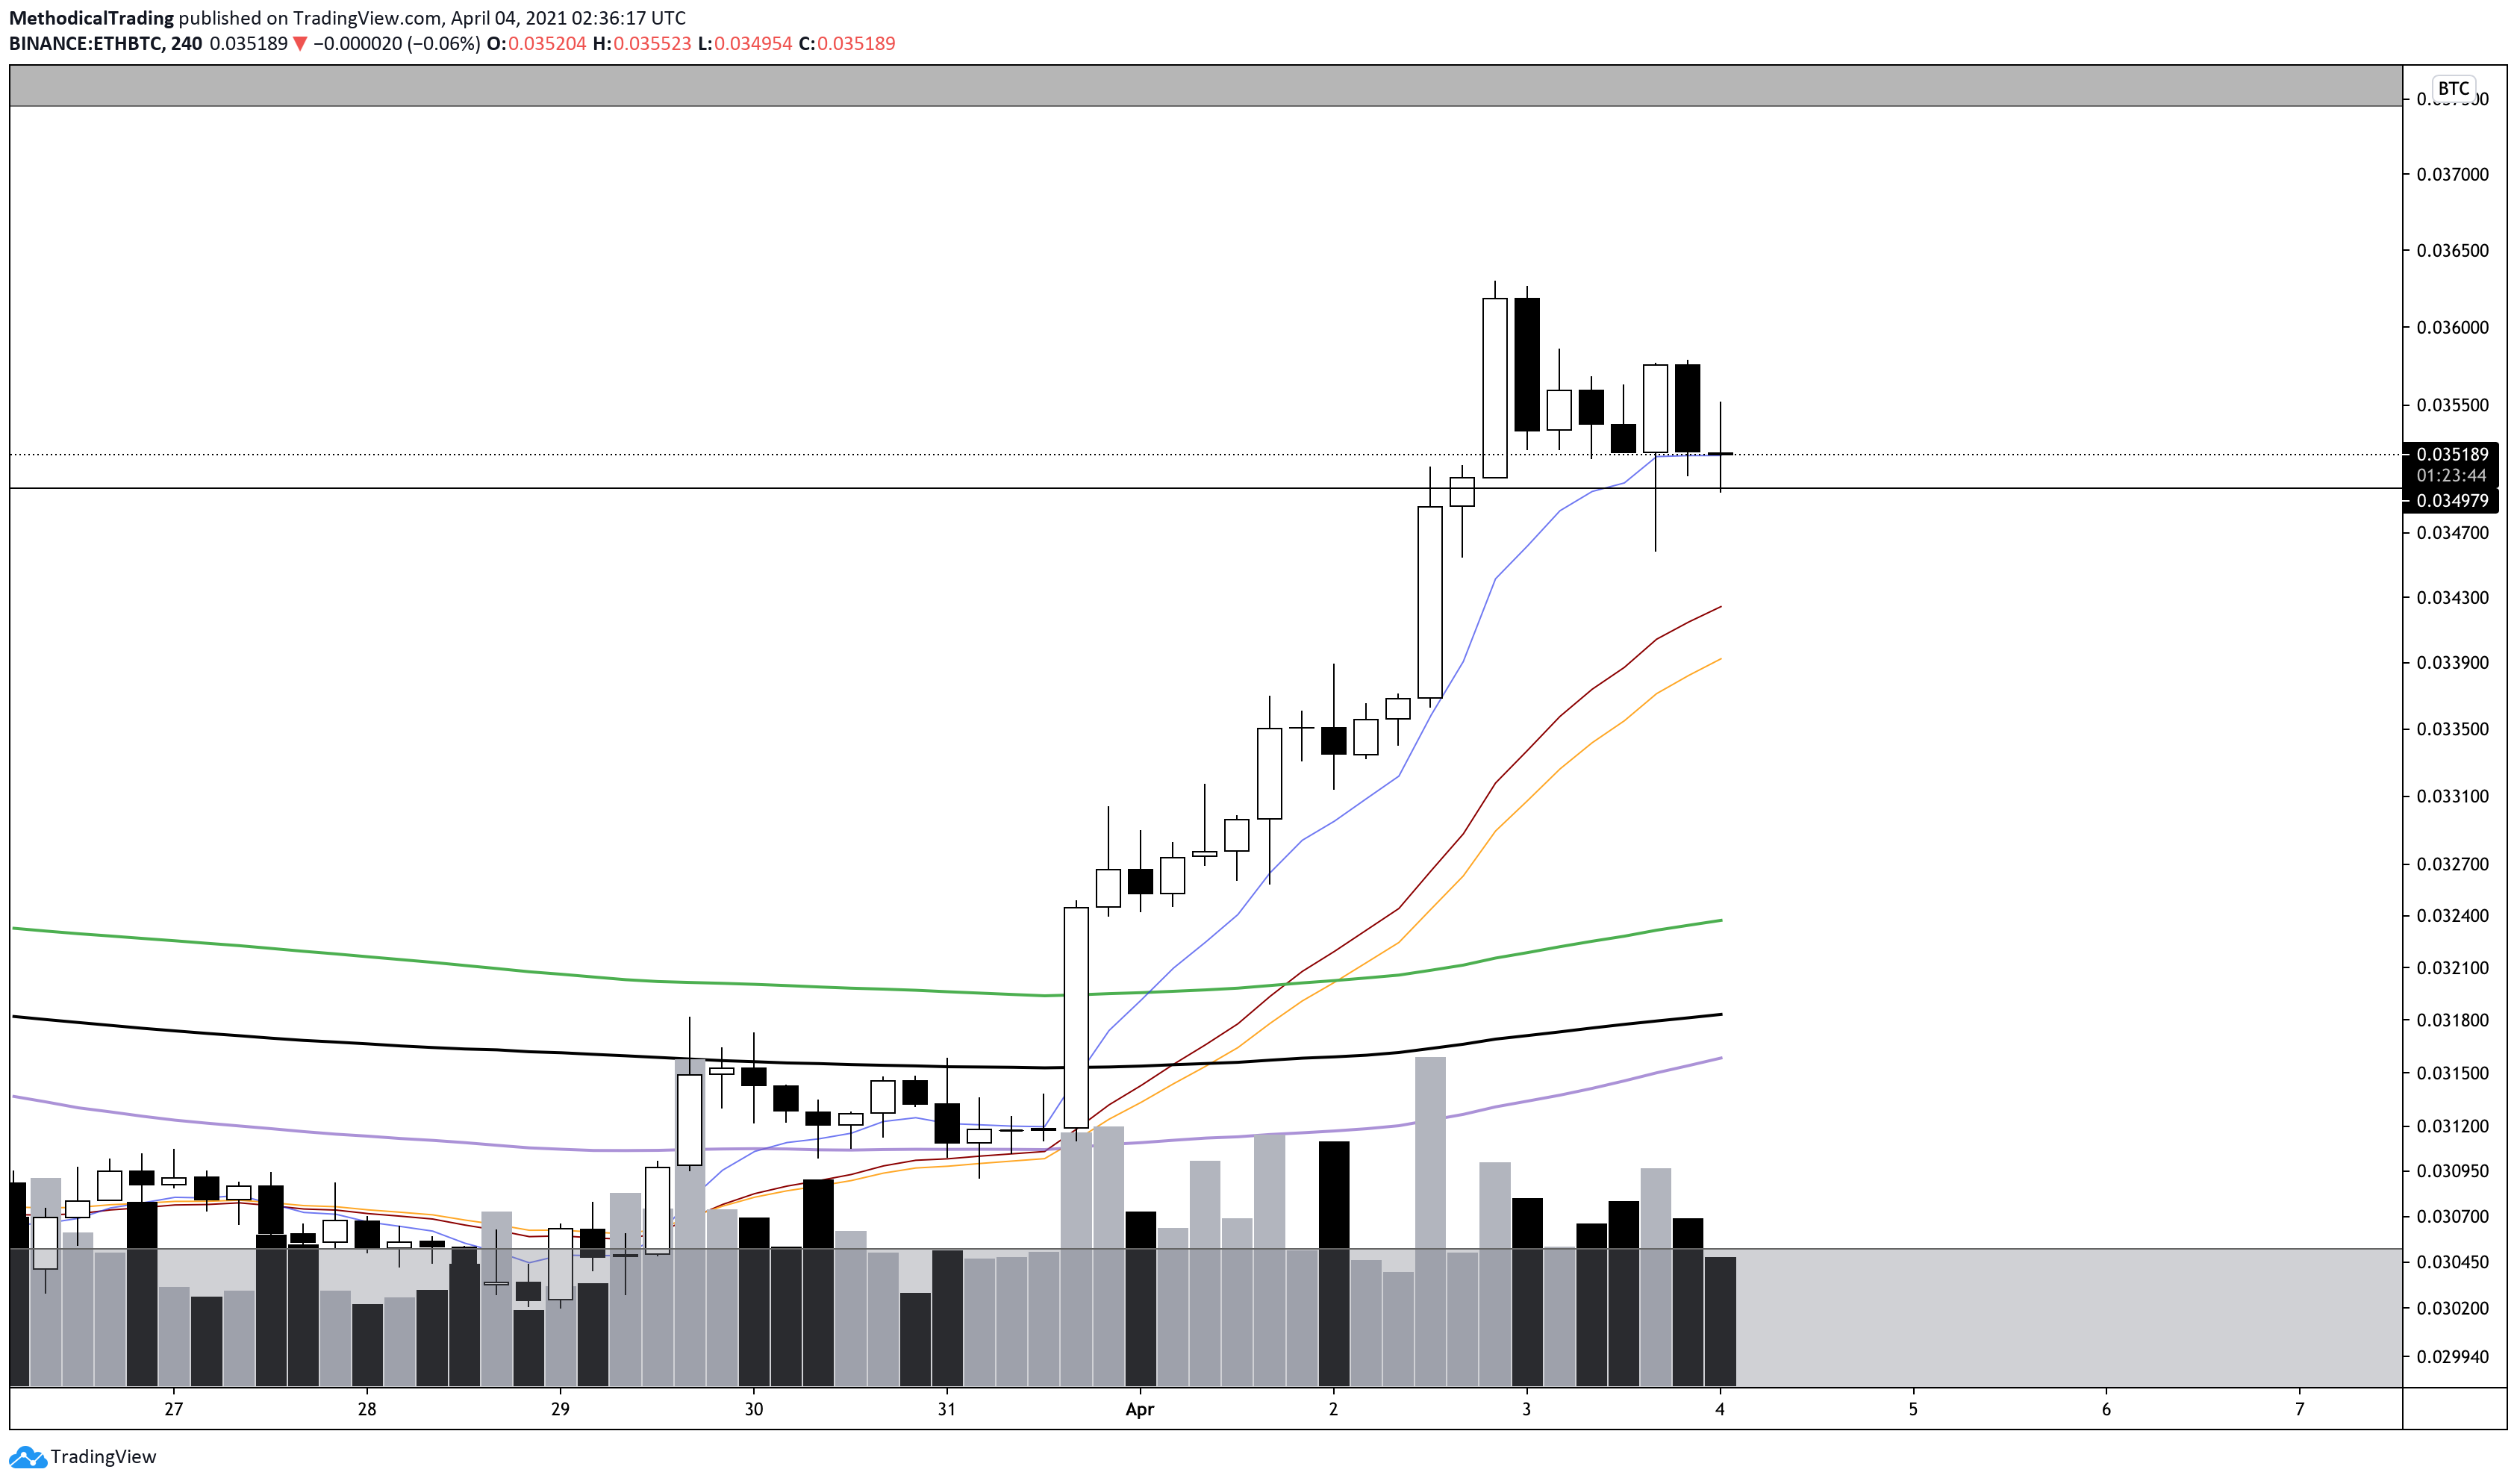
Zooming into the 4 hour, the current trend has successfully held the EMA 8 (Blue) multiple times. The EMA 8 is typically a sign of an extremely strong and nearly parabolic trend. The consolidation here should be a sign that price may move higher once again in confluence with the flip of Resistance into Support. As mentioned beforehand, this would likely mean a trip towards the upper gray region is in the near future.
If price were to fall below the EMA 8, then the 21/26 EMA’s would be the next stop. This would also be a trigger for long entries as well if price were to continue riding the current trend.
Altcoin Circus!
Alts have been popping off left and right as a result of Bitcoin’s recent consolidation. ETH/BTC is usually another indicator that Alts will also run hard as well.
SOLPERP:
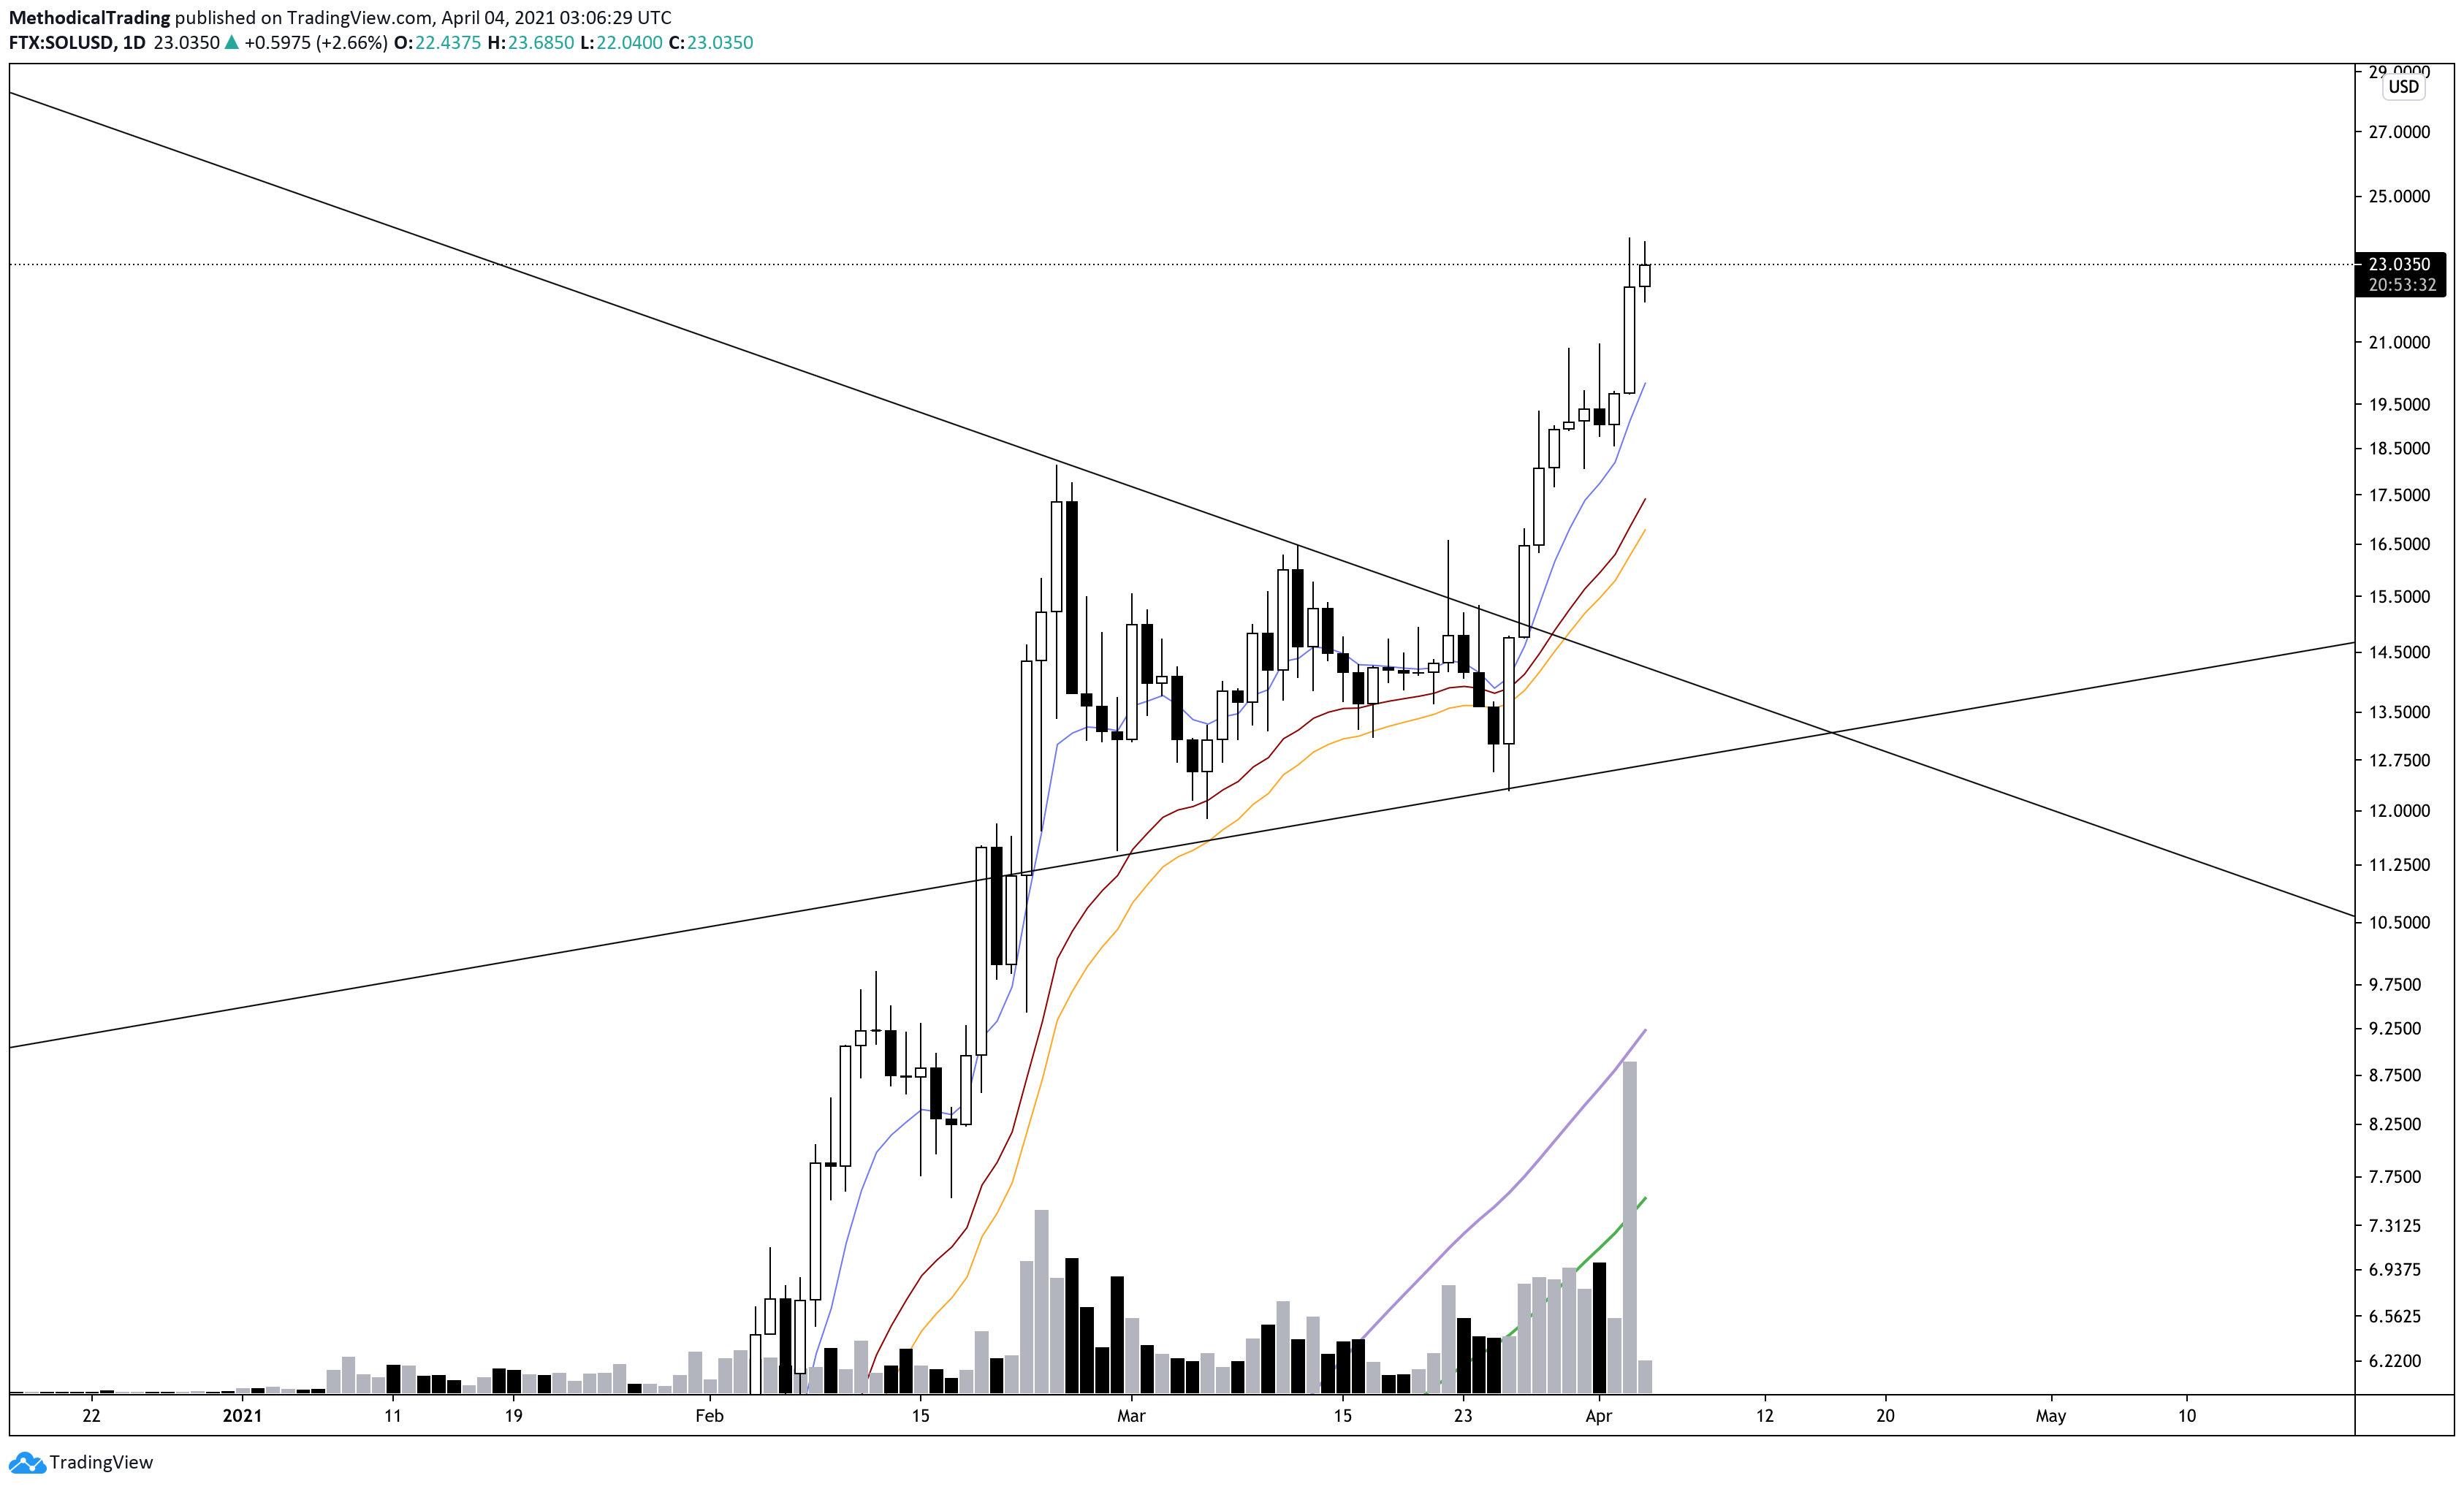
SOL has been performing exceptionally well over the past few months. The breakout of the bull pennant about a week and a half ago has lead to further price discovery. SOL is also one of the few projects that SBF Alameda consistently updates and makes continuous progress on. As the CEO of FTX, SBF has continued to drive and push the entire crypto industry forward. The three coins that he updates and pushes out constantly are a combination of FTT, SOL, and SRM. These three are available as a combined basket as “HOLY” on FTX. The technicals look fantastic here for SOL as it continues to push higher and the fundamentals are extremely bullish. This project is a long term hold for the remainder of the bull market and any dips should be seen as buying opportunities!
TRXUSD:
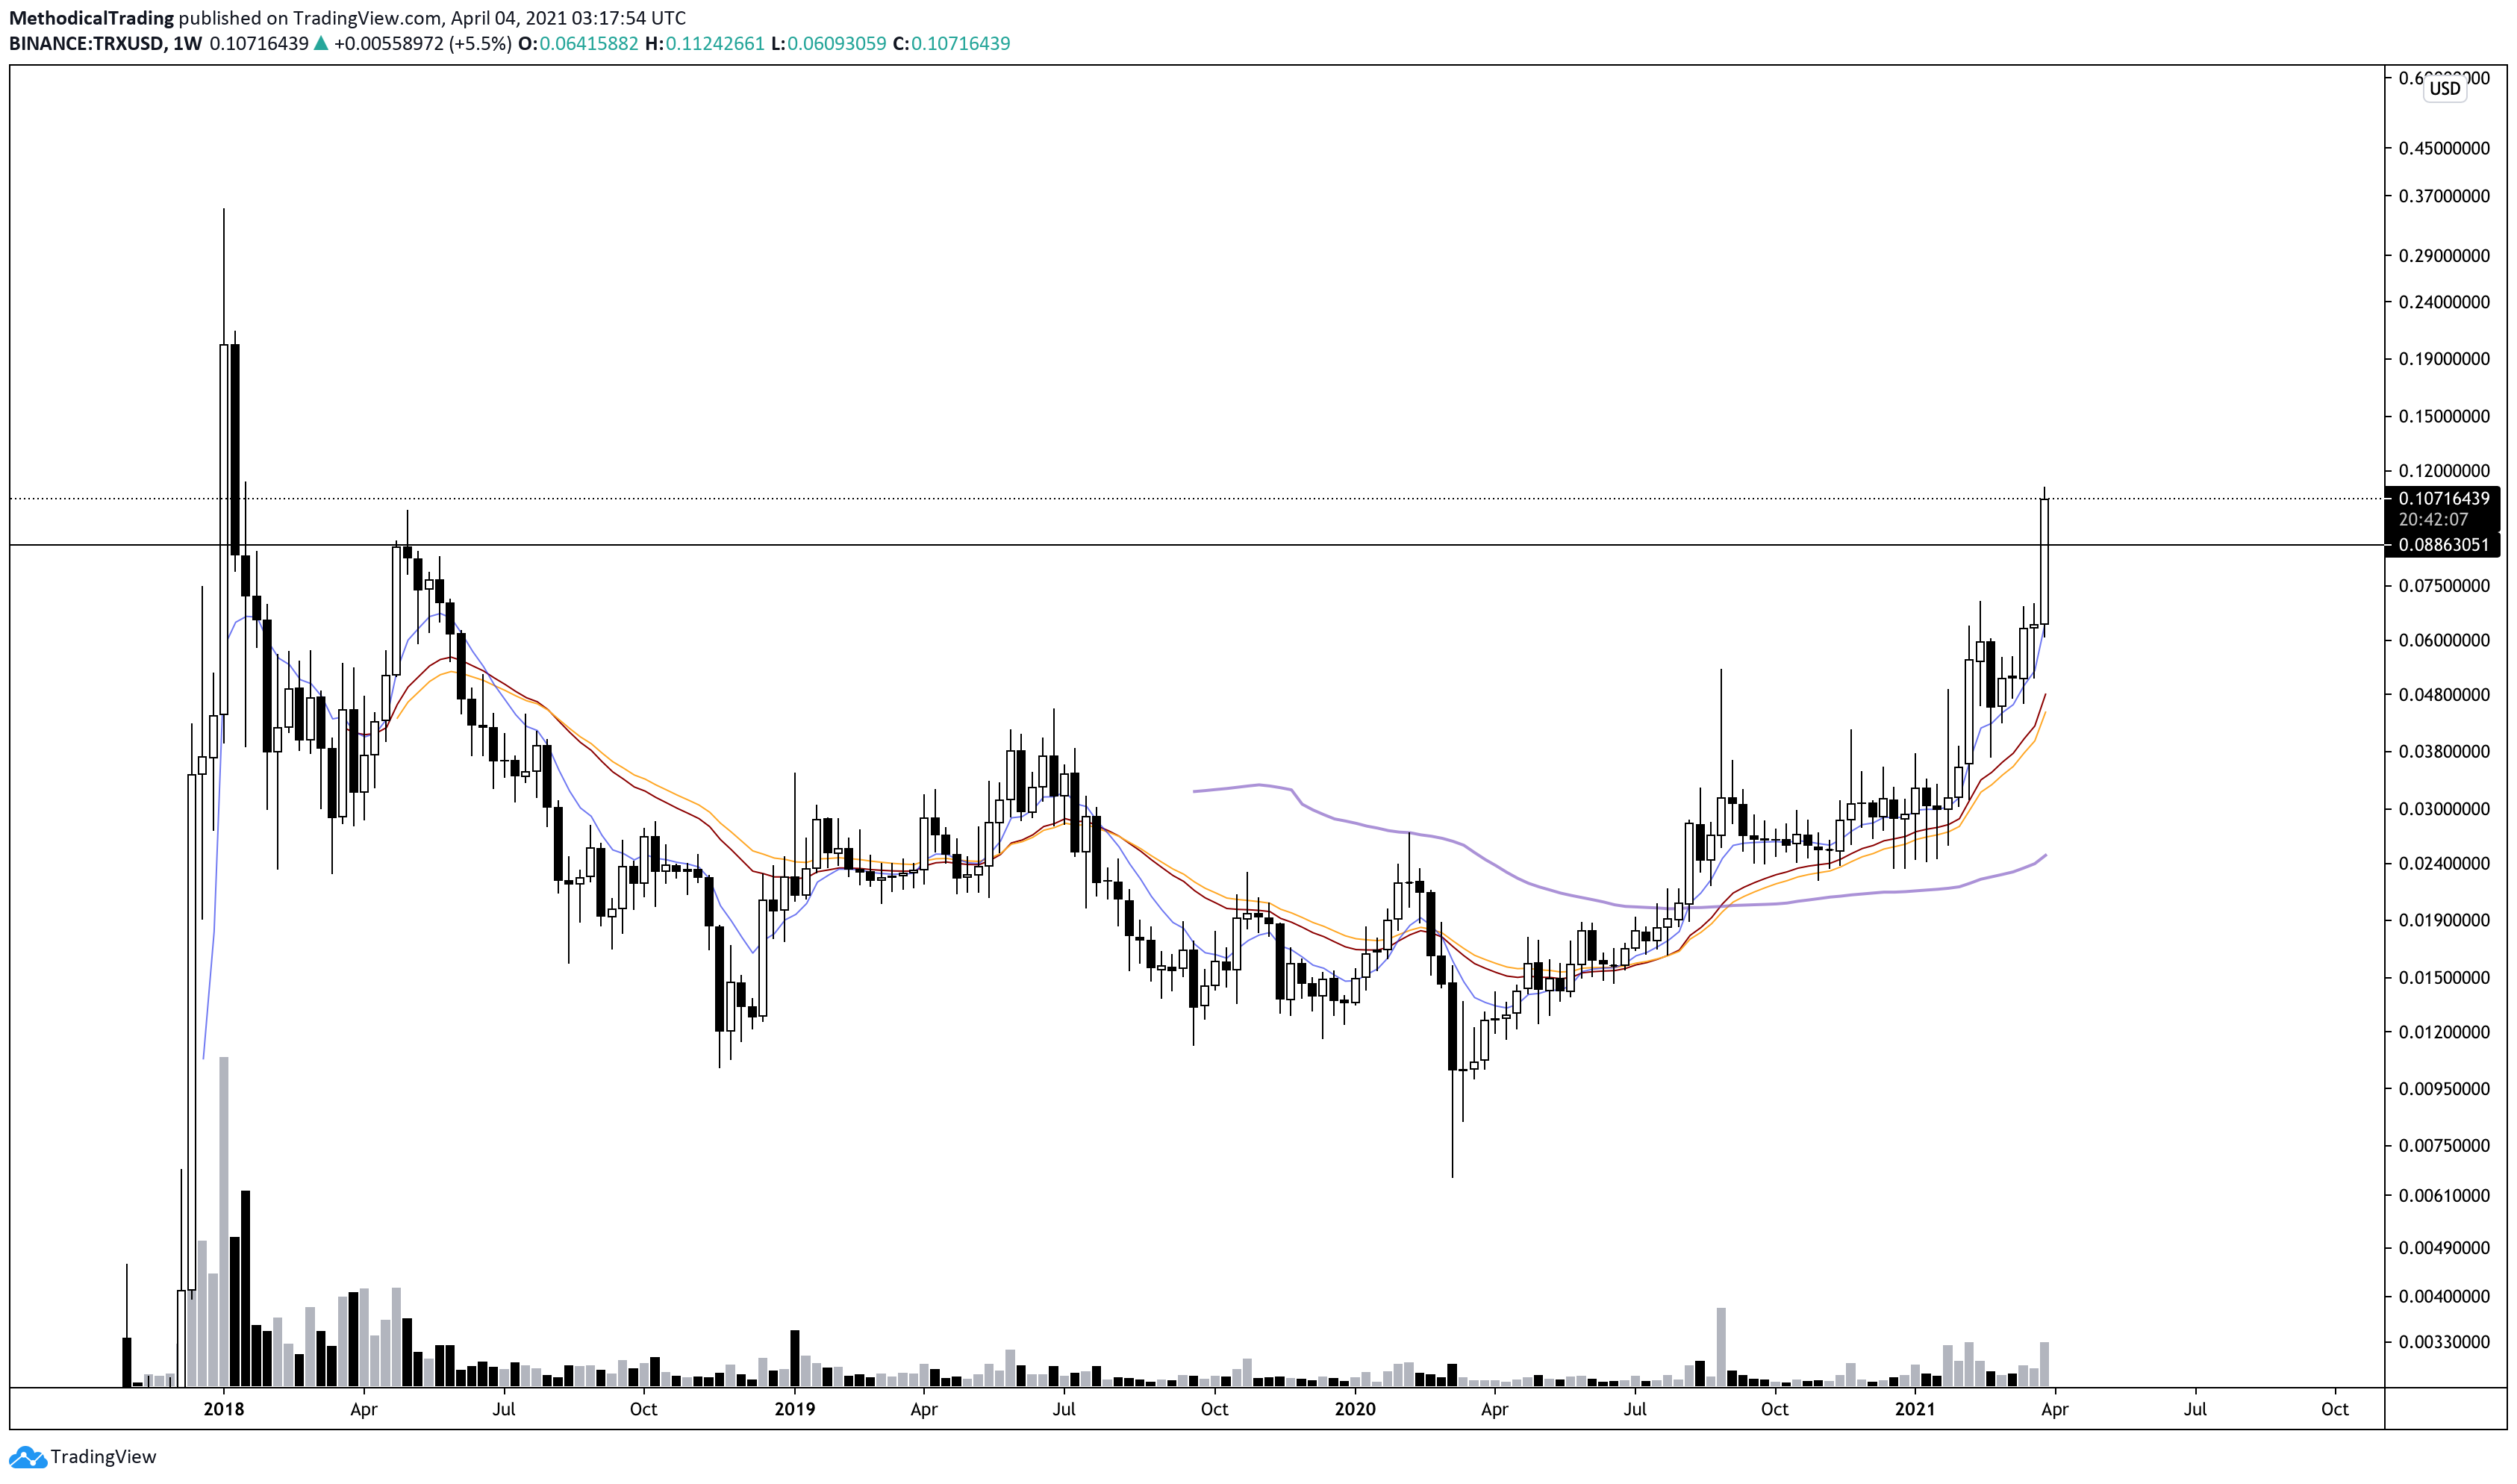
The Weekly chart for TRX/USD looks extremely bullish. Price has finally broken out of a nearly 3 year resistance that was established back in early 2018. Currently, TRX/USD is visiting levels not seen since the previous bull market and the blowoff top from late 2017. During this time period, TRX quickly rose to 0.30 cents in a relatively short time frame. Today, the market has matured greatly and a parabolic rise in that manner may not repeat itself, However, the chart speaks for itself and it seems more than likely that TRX will continue pushing higher into 20 cents and beyond in the coming weeks and months.
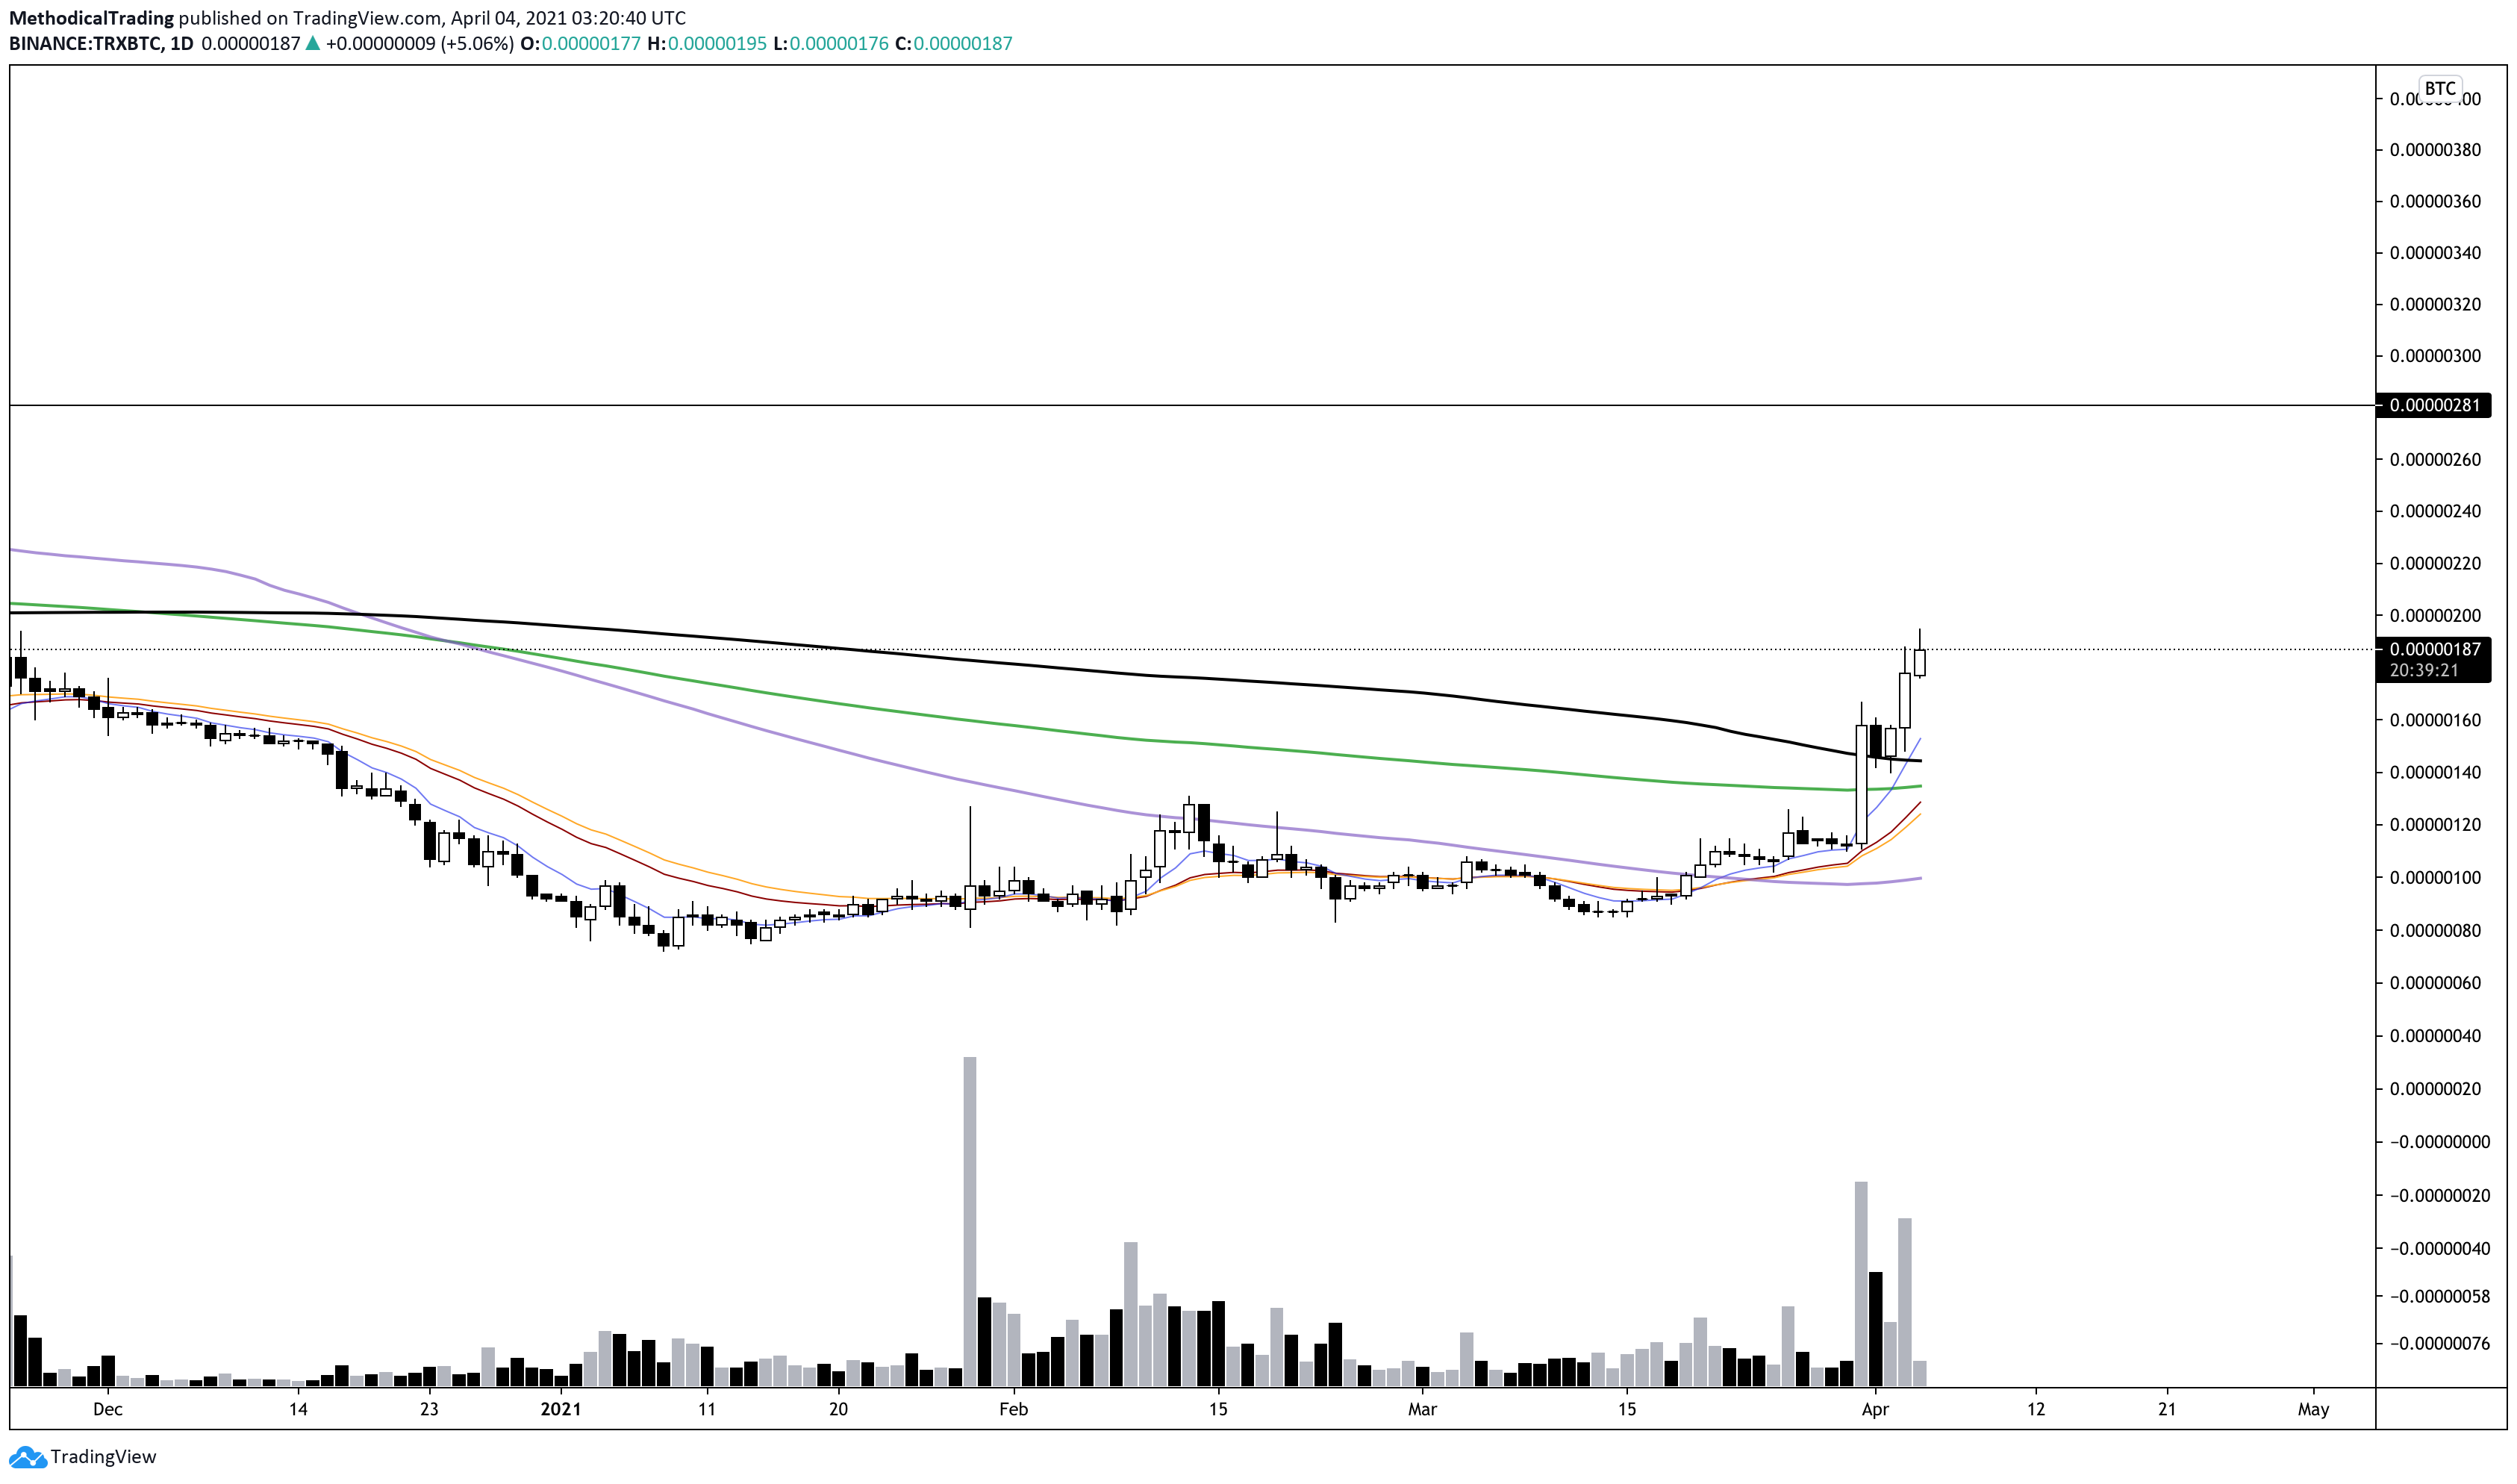
The BTC pair has had some strong volume come in along with a break of the Daily 200 EMA and 200 MA. This is a strong sign that the macro bottom has been put in for the BTC pair and supports the idea that TRX will continue rising higher on the USD pair as well. It has taken months upon months for price to break the 200 EMA/MA’s and this final break here should absolutely NOT be ignored!
BNBUSD:
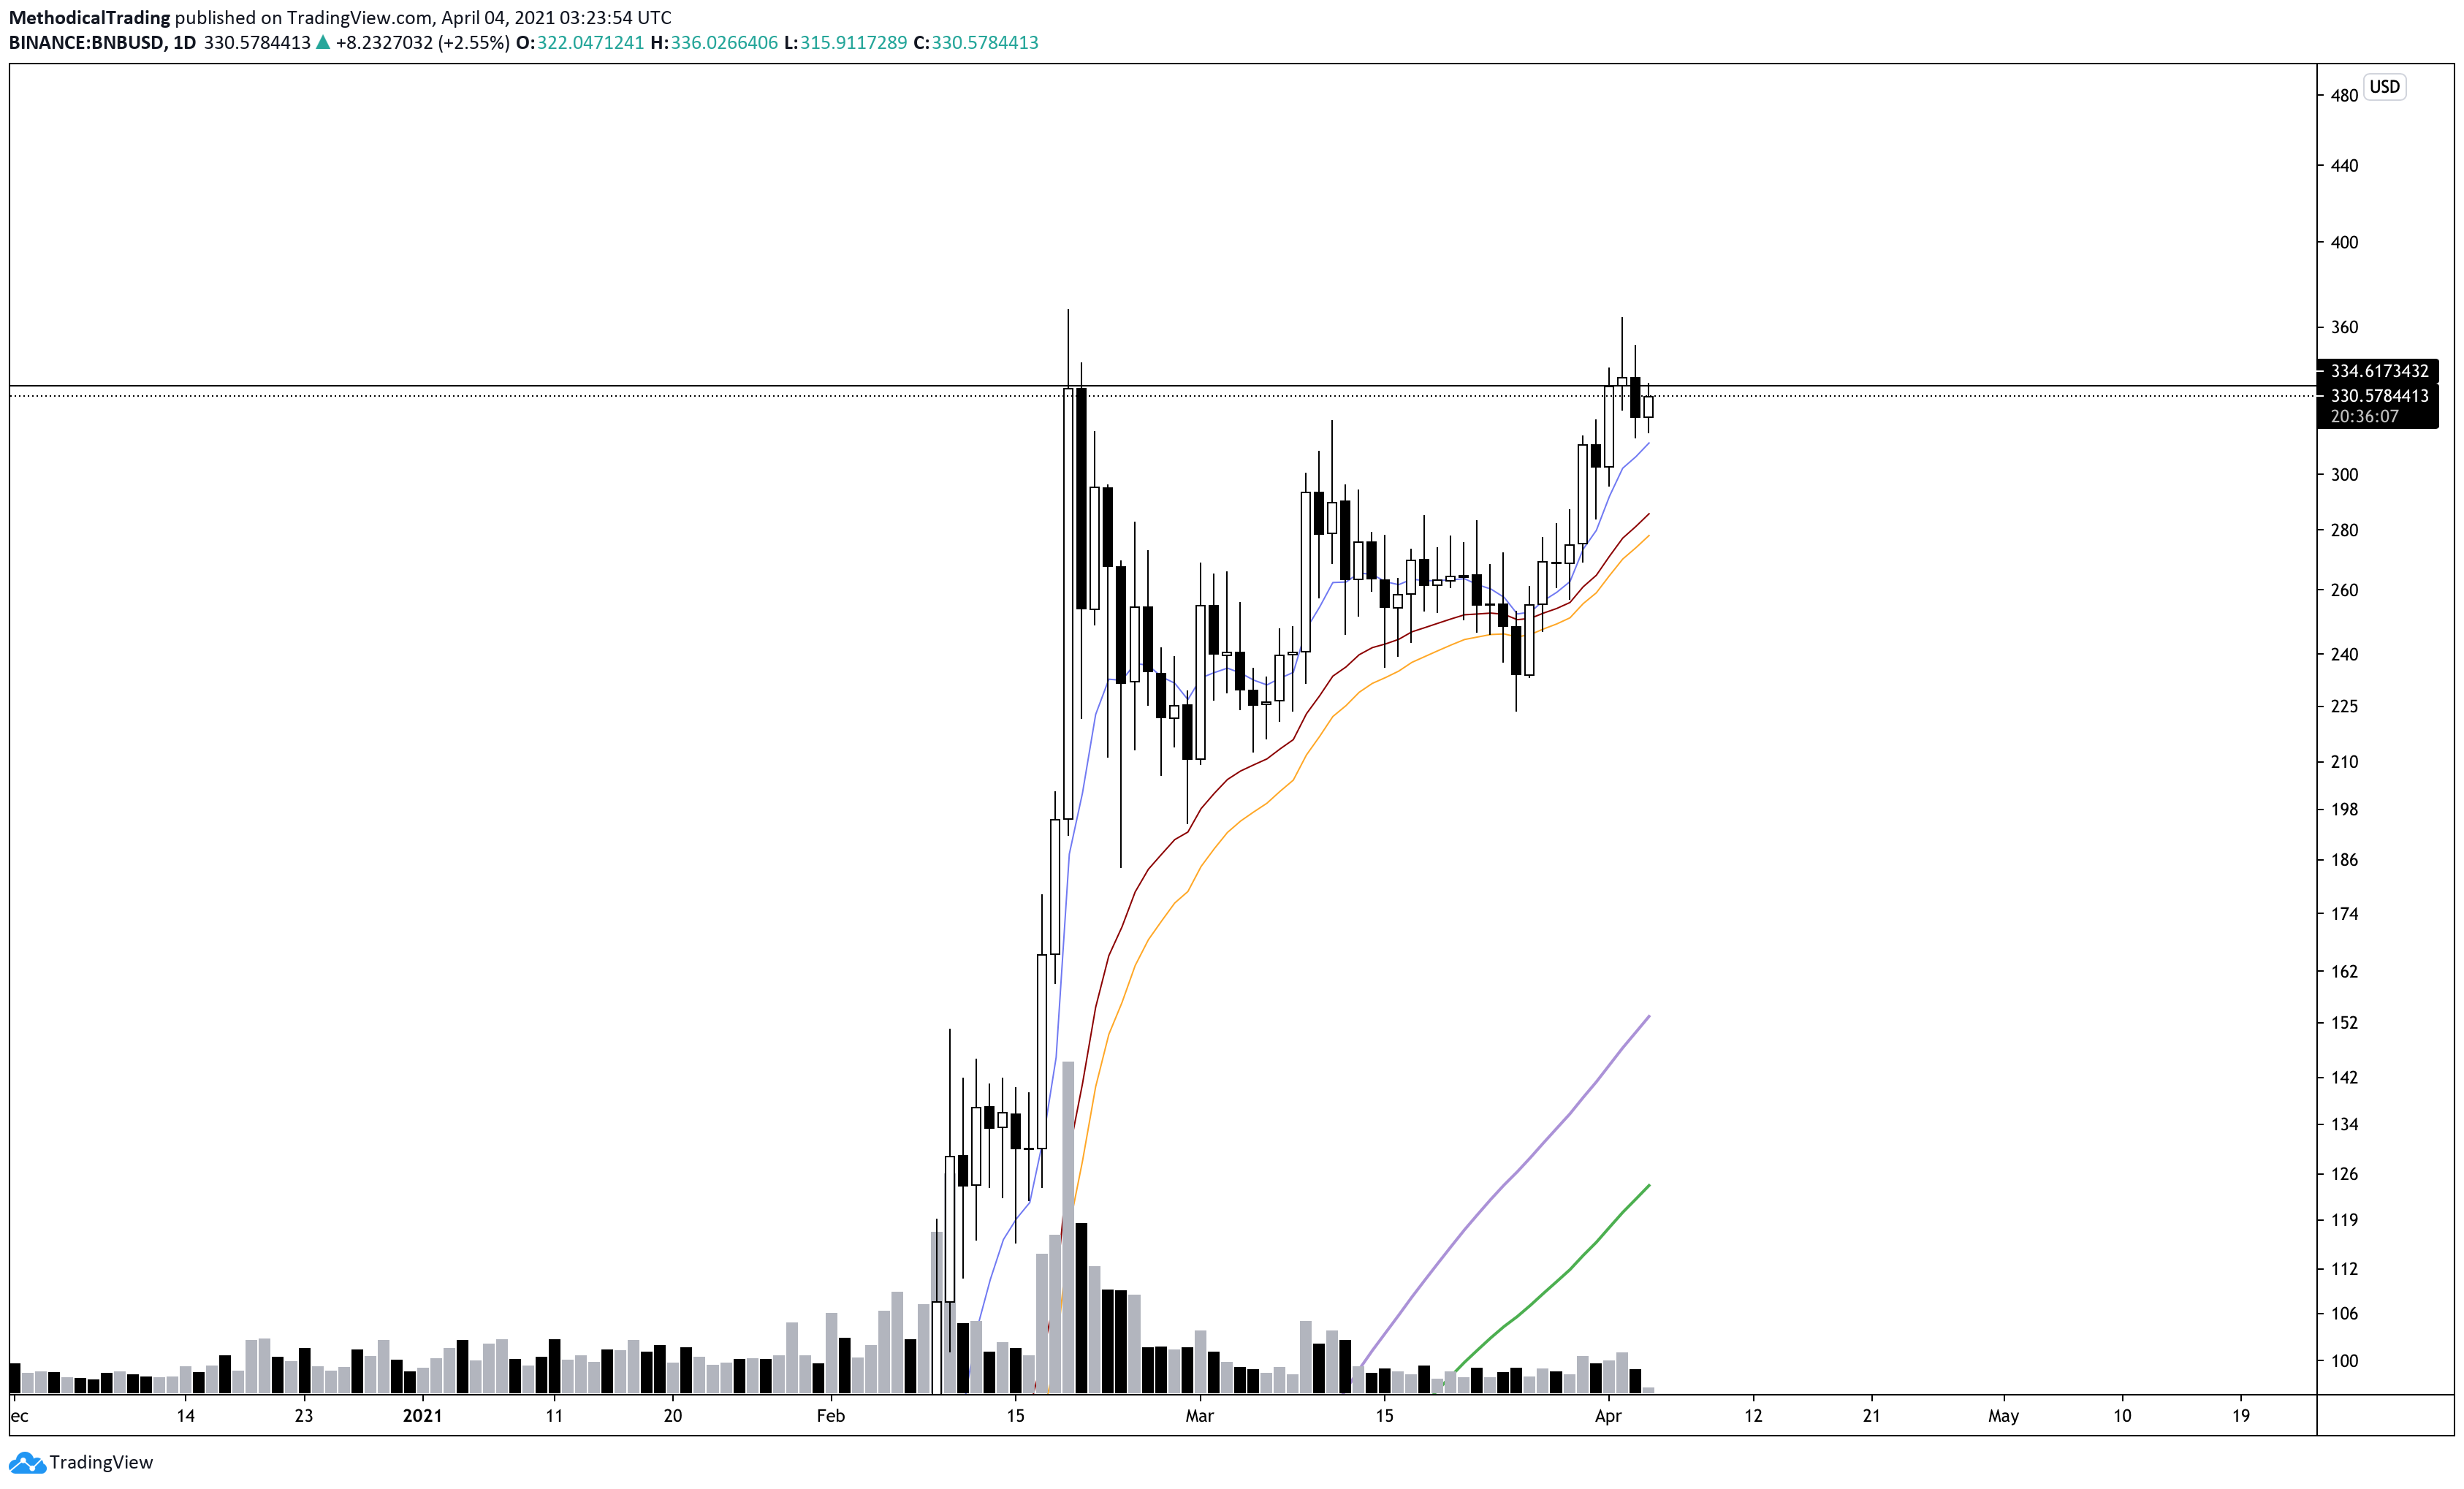
BNB is retesting previous All Time Highs again and is facing some resistance here. Price is currently consolidating just below it and may be a sign of bullishness. Without a firm or high volume rejection, it is difficult to be bearish here despite the current resistance. Make no mistake, this does not mean to enter Long positions here, but it is something to take note of and keep on the watchlist. A breakout and retest would be an extremely bullish sign and be a trigger for Long positions. Fundamentally, the Binance exchange is one of the biggest global crypto exchanges. BNB has a variety of use cases for any Binance user and is likely to continue pushing higher for the remainder of the bull market. $500 BNB may not be so far away after all!
DOTUSDT:
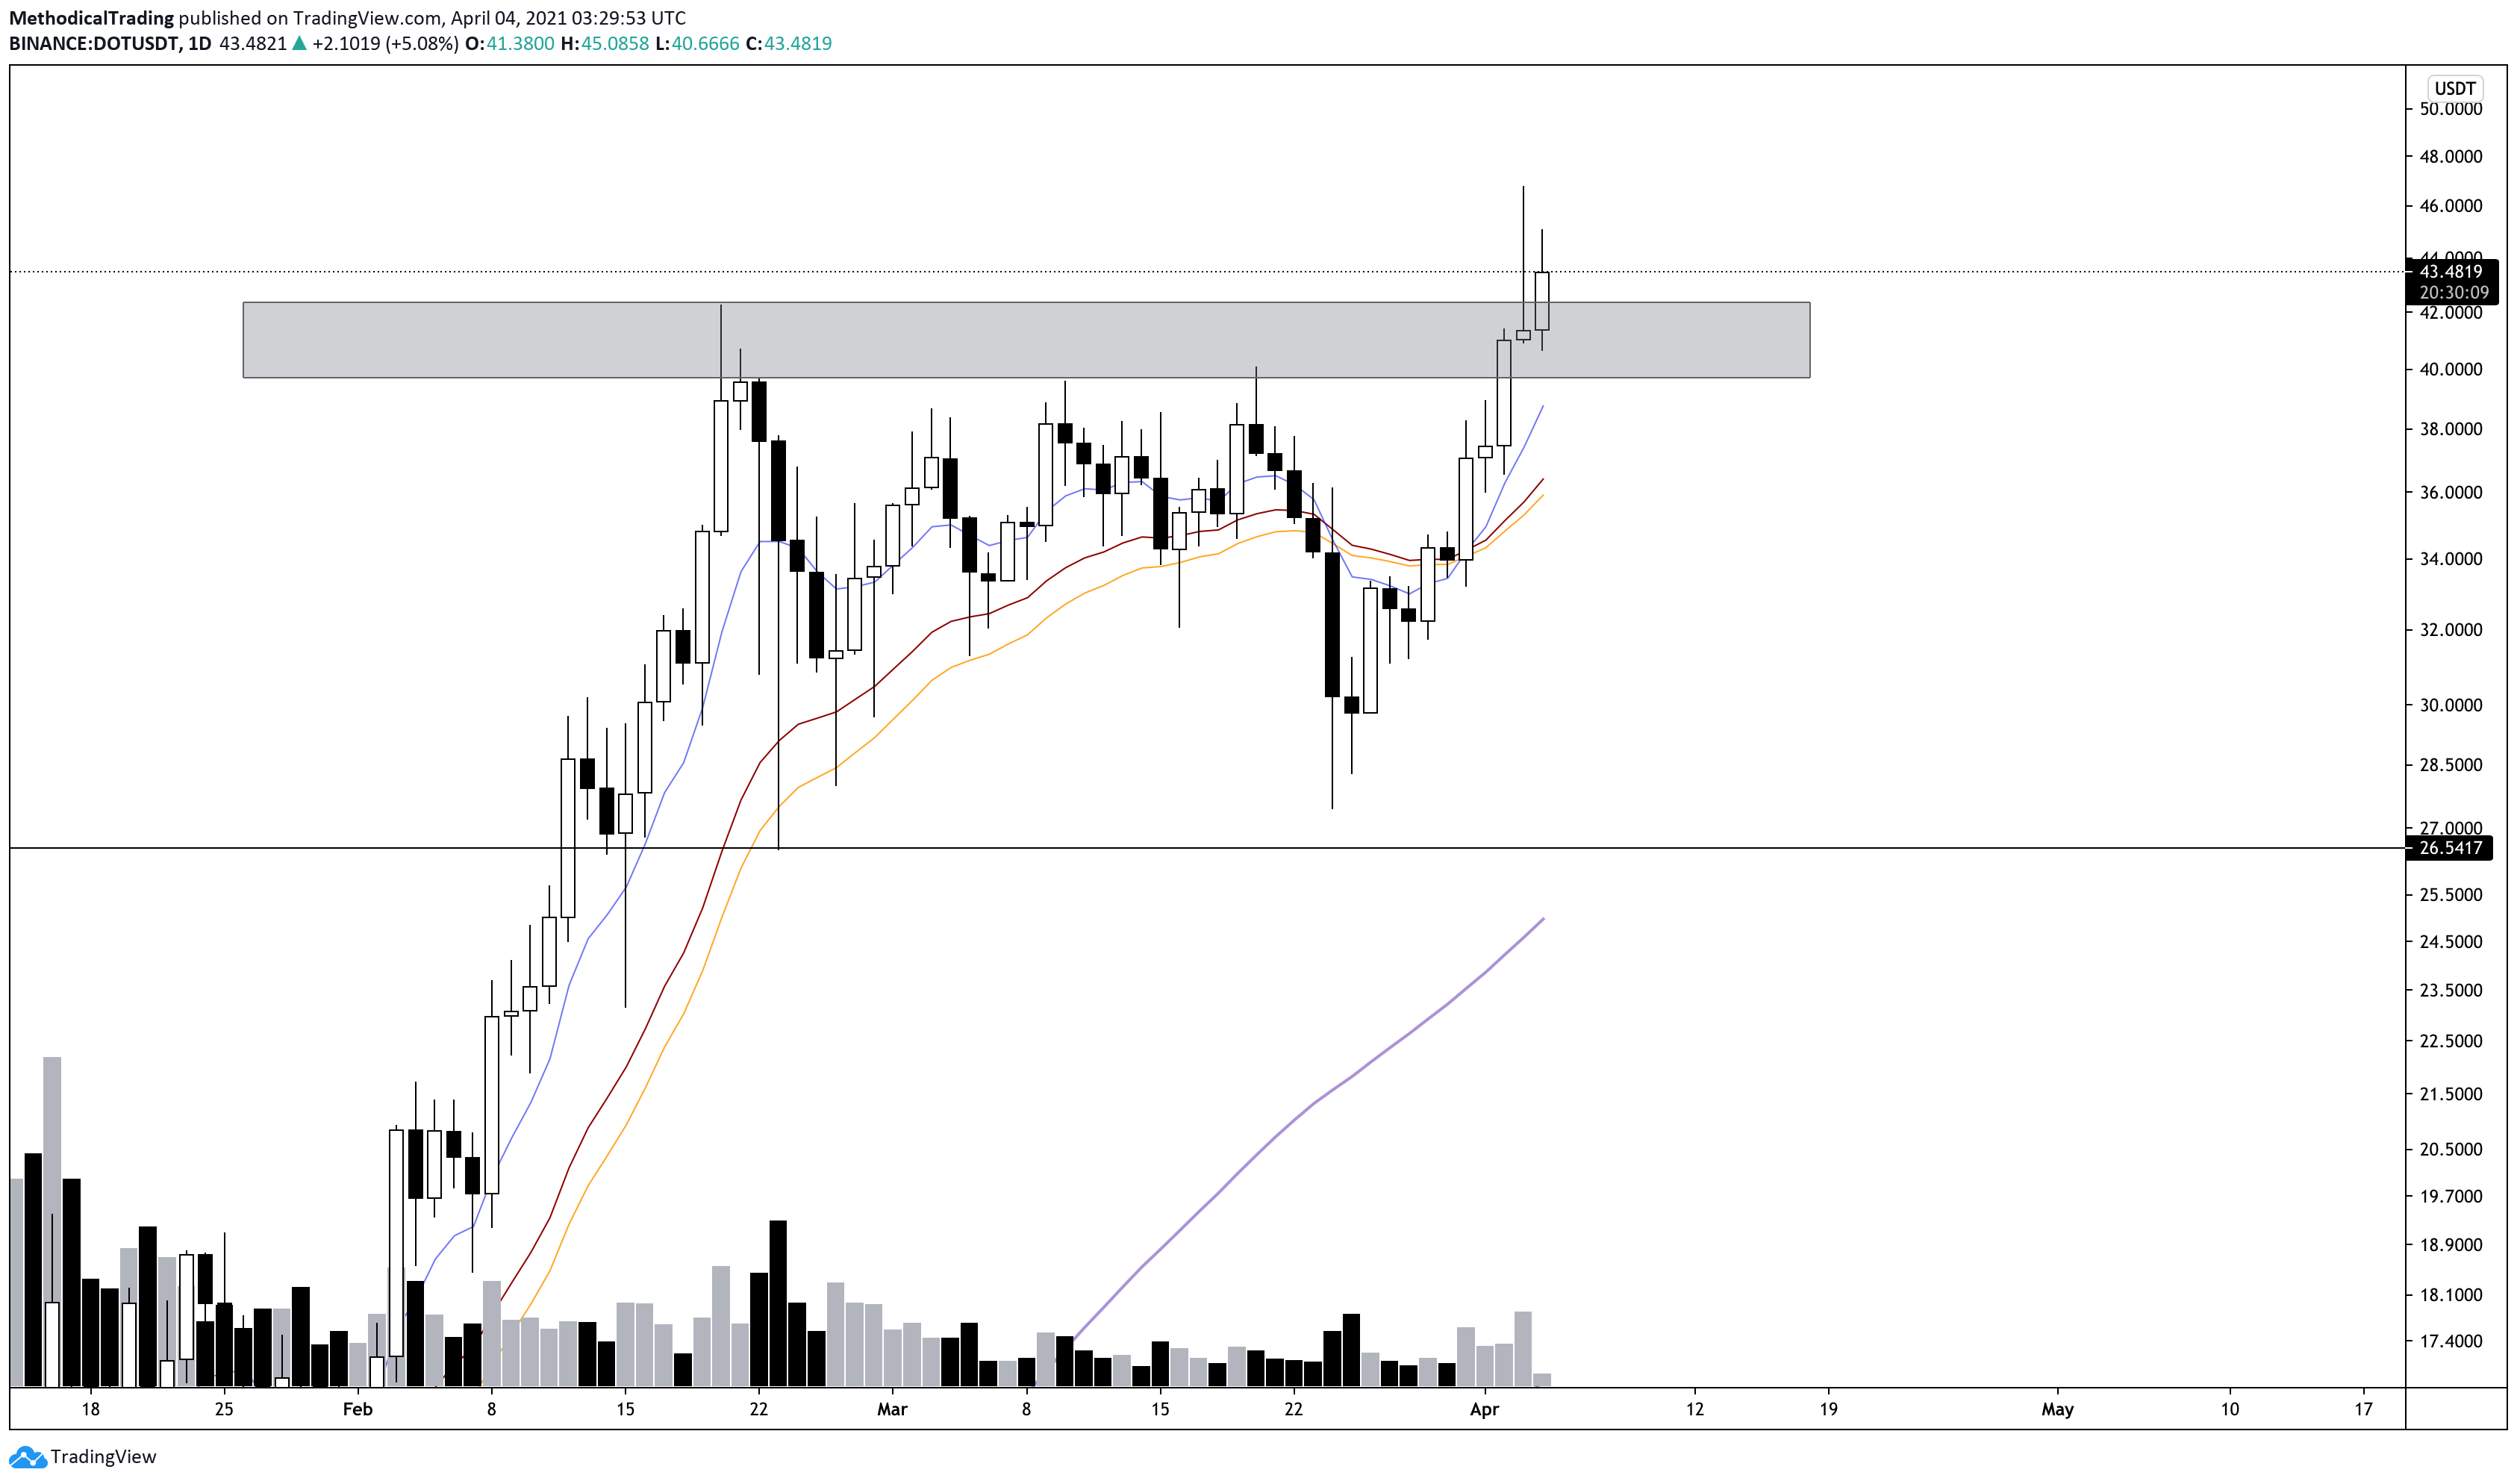
DOT is another fundamentally bullish project as well. Price is currently just above the previous Resistance and looks to be flipping it into Support. As a project, is serves as the base layer for an ecosystem. Similar to ETH, SOL, and BNB, this is one of the coins that should outperform many other majors or mid-cap projects for the remainder of the bull market. Any further dip into the gray region may be a strong buying opportunity. This is ideally not a leveraged play, but a place to add to Spot bags and to continue riding for at least 2-3x gains.
DEFIPERP:
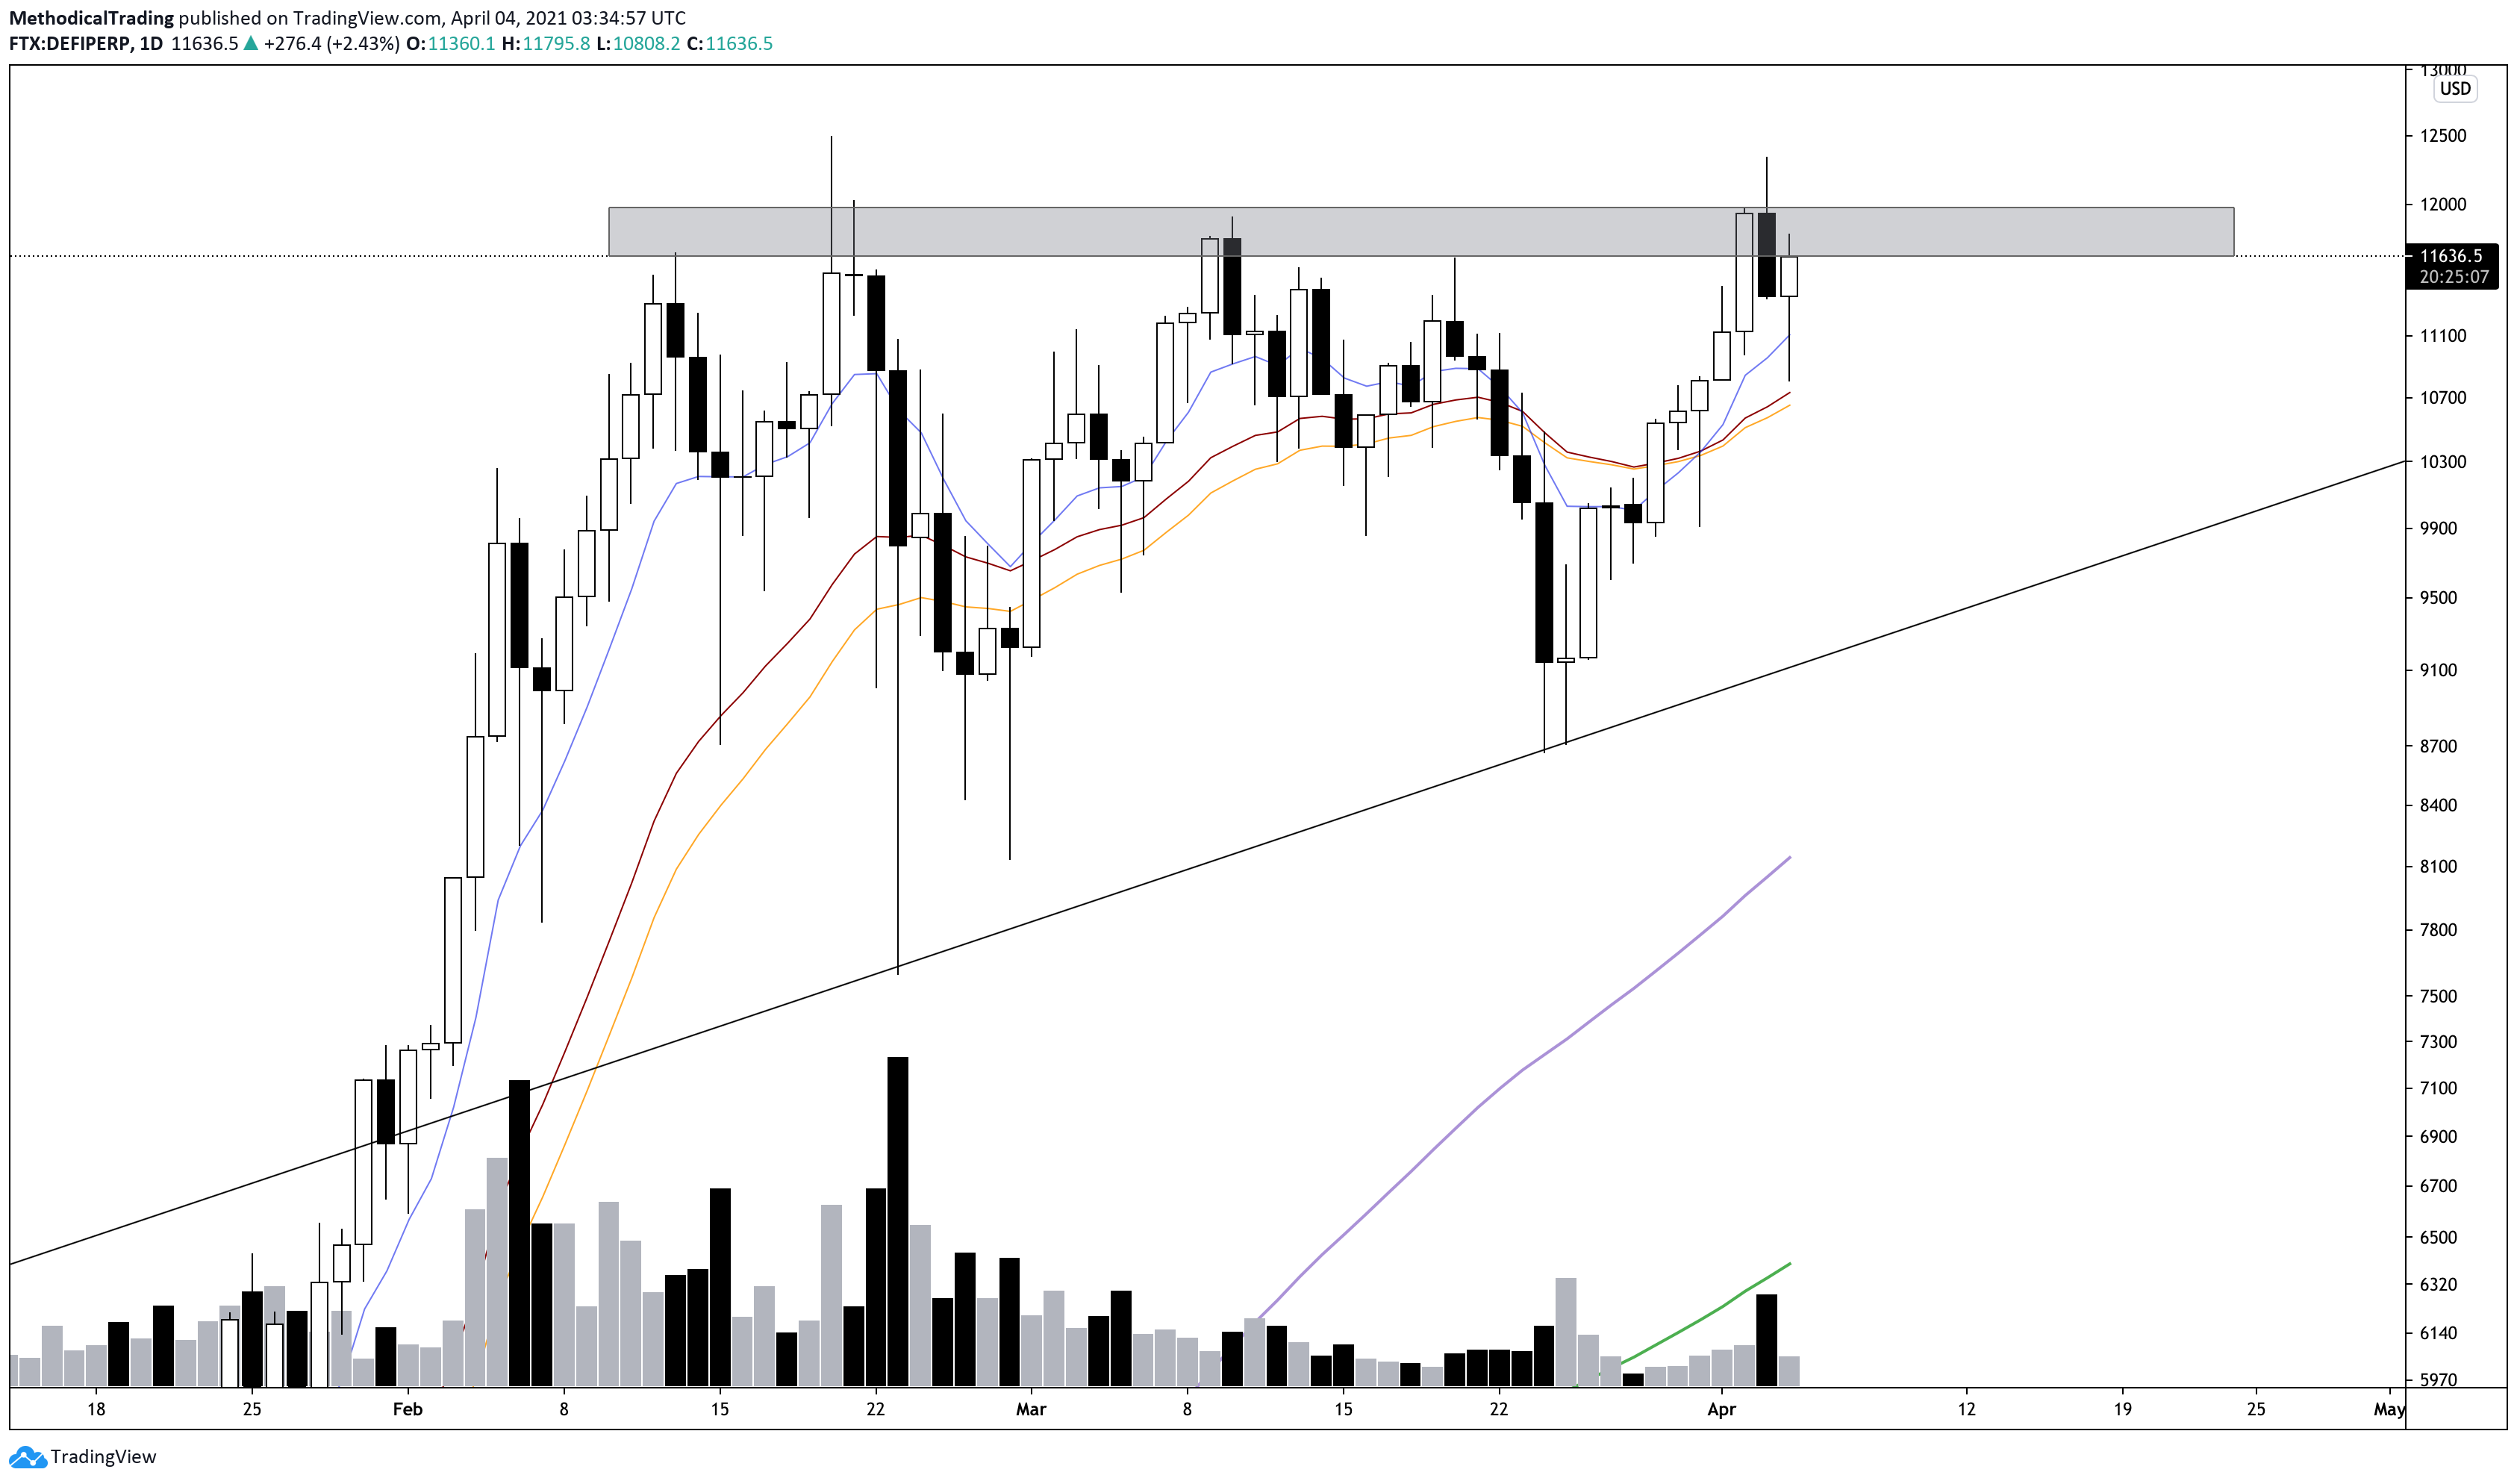
The DEFI basket is the strongest of all the Indexes available on FTX. It has been consolidating and has tested the $12,000 level multiple times over the past couple of months. Price has set Higher Lows while tapping away at the above resistance. A majority of the coins within the DEFI basket are fundamentally bullish and contributes to how strong the trend in DEFI has been over the past 8 months. Similar to DOT and BNB, a breakout and retest of $12,000 would be a Long signal. It seems likely that price will shoot for much higher and go on another parabolic rise once the $12,000 level is broken. This scenario is invalid if price breaks down below the Higher low structure.
Institutions
Institutions continue to pour into Bitcoin with a significant amount of outflows taking place over the past few weeks. VISA also announced that they would be using Ethereum in order to enable payments via USDC in the future. With Bitcoin breaking the $1 Trillion Market Cap and further adoption taking place through large institutions, crypto currency is no longer a “gamble” or an extremely “speculative asset class.” As the market has matured, crypto has evolved into something that institutions are adopting and is quickly moving away from the “gambler” or “speculative” mentality.


The CEO of cryptoquant, Ki Young Ju, continues to provide updates for on-chain analysis and the Tweets above show strong outflows and further adoption taking place. As more and more outflows take place with bigger institutions getting into crypto, one can make an educated guess that the bull market is nowhere near over! Bitcoin, Ethereum, and a majority of the fundamentally bullish projects within crypto will print serious gains for the remainder of 2021.
Don’t over leverage. Load up on Spot bags. Use dips as buying opportunities and most importantly…
Keep calm and HODL on!
Please note that this newsletter is NOT Financial Advise. Neither Methodical Trading and/or it’s associates should be considered Financial Advisors. Any and ALL related Market centric material should be considered educational content for entertainment only. Methodical Trading and/or it’s associates are not responsible for any financial endeavors an individual/group chooses to take.